This page is historical material reflecting the Feedback Loop Blog as it existed on
February 15, 2012. This page is no longer updated and links to external websites
and some internal pages may not work.
February 15, 2012
Archived: Fiscal Year 2011 R01 Funding Outcomes and Estimates for Fiscal Year 2012
Fiscal Year 2011 ended on September 30, 2011. As in previous years, we have analyzed the funding results (including percentiles and success rates) for R01 grants, shown in Figures 1-5. Thanks to Jim Deatherage for preparing these data.
 and funded (solid bars) in Fiscal Year 2011.") View larger image
View larger image
 View larger image
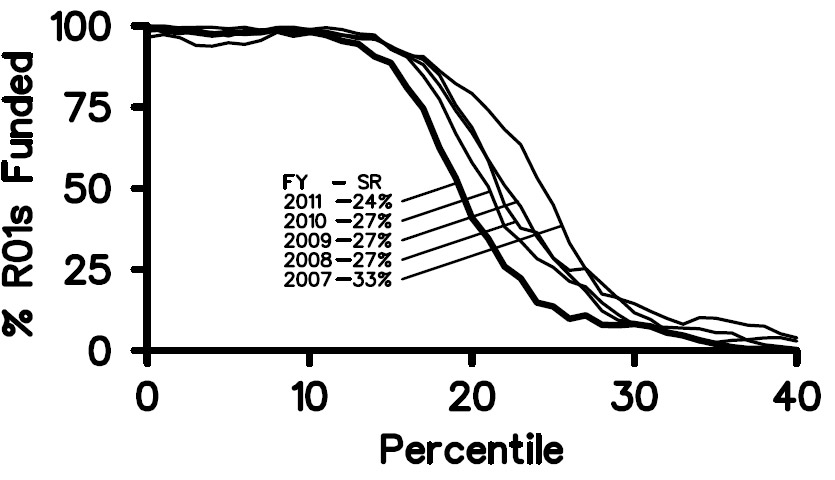
Although the number of competing R01 awards funded by NIGMS in Fiscal Year 2011 was nearly identical to those in the previous 2 years (Figure 3), the success rate declined in 2011. Factors in this decline were a sharp increase in the number of competing applications that we received in 2011 (Figure 4) along with a decrease in total funding for R01s due to an NIH-wide budget reduction. For more discussion, read posts from Sally Rockey of the NIH Office of Extramural Research on NIH-wide success rates and factors influencing them.
View larger image
Although the number of competing R01 awards funded by NIGMS in Fiscal Year 2011 was nearly identical to those in the previous 2 years (Figure 3), the success rate declined in 2011. Factors in this decline were a sharp increase in the number of competing applications that we received in 2011 (Figure 4) along with a decrease in total funding for R01s due to an NIH-wide budget reduction. For more discussion, read posts from Sally Rockey of the NIH Office of Extramural Research on NIH-wide success rates and factors influencing them.
 funded in Fiscal Years 1997-2011.") View larger image
View larger image
 received during Fiscal Years 1998-2012.") Below are the total NIGMS expenditures (including both direct and indirect costs) for R01 and R37 grants for Fiscal Year 1995 through Fiscal Year 2011.
Below are the total NIGMS expenditures (including both direct and indirect costs) for R01 and R37 grants for Fiscal Year 1995 through Fiscal Year 2011.
 in Fiscal Years 1995-2011") In Fiscal Year 2012, we have received about 3,700 competing R01 grant applications (including revisions) and anticipate funding about 850 of these with the Fiscal Year 2012 appropriation. We expect the R01 success rate to be between 24% and 25%.
Because the competing application numbers and the total R01 budgets for Fiscal Years 2011 and 2012 are similar, the funding trends will likely be comparable.
In Fiscal Year 2012, we have received about 3,700 competing R01 grant applications (including revisions) and anticipate funding about 850 of these with the Fiscal Year 2012 appropriation. We expect the R01 success rate to be between 24% and 25%.
Because the competing application numbers and the total R01 budgets for Fiscal Years 2011 and 2012 are similar, the funding trends will likely be comparable.
View larger image
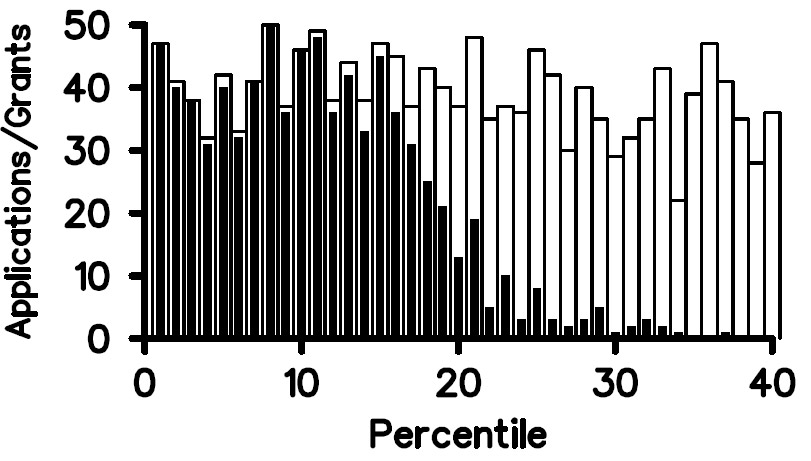
Figure 1. Competing R01 applications reviewed (open rectangles) and funded (solid bars) in Fiscal Year 2011.
View larger image
Figure 2. NIGMS competing R01 funding curves for Fiscal Years 2007-2011. For Fiscal Year 2011, the success rate for R01 applications was 24%, and the midpoint of the funding curve was at approximately the 19th percentile.
View larger image
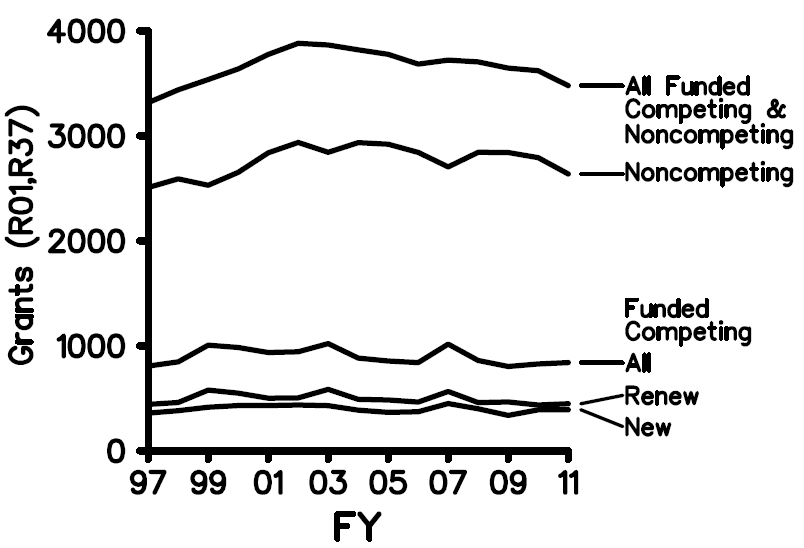
Figure 3. Number of R01 and R37 grants (competing and noncompeting) funded in Fiscal Years 1997-2011.
Figure 4. Number of competing R01 applications (including revisions) received during Fiscal Years 1998-2012.
Figure 5. The upper curve shows the overall NIGMS expenditures on R01 and R37 grants (competing and noncompeting, including supplements) in Fiscal Years 1995-2011. The lower curve (right vertical axis) shows the median direct costs of NIGMS R01 grants. Results are in actual dollars with no correction for inflation.
About the Author