Archived: Improved Success Rate and Other Funding Trends in Fiscal Year 2014
The Consolidated and Further Continuing Appropriations Act, 2015, provides funding for the Federal Government through September 30. NIGMS has a Fiscal Year 2015 appropriation of $2.372 billion, which is $13 million, or 0.5%, higher than it was in Fiscal Year 2014.
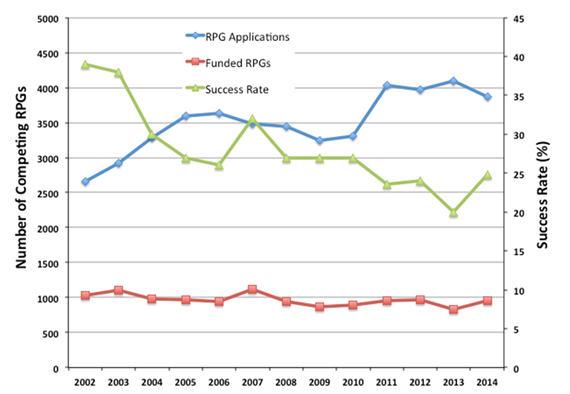
As I explained in an earlier post, we made a number of adjustments to our portfolio and funding policies last fiscal year in order to bolster our support for investigator-initiated research. Partly because of these changes, the success rate for research project grants (RPGs)—which are primarily R01s—was 25 percent in Fiscal Year 2014. This is 5 percentage points higher than it was in Fiscal Year 2013. Had we not made the funding policy changes, we predicted that the success rate would have remained flat at 20 percent.
Figure 1 shows the number of RPG applications we received and funded, as well as the corresponding success rates, for Fiscal Years 2002-2014.

Moving forward, it will be important to employ strategies that will enable us to at least maintain this success rate. In keeping with this goal, we recently released a financial management plan (no longer available) that continues many of the funding policies we instituted last year. As funds from the retirement of the Protein Structure Initiative come back into the investigator-initiated RPG pool, we’ll be working to ensure that they support a sustained improvement in success rate rather than create a 1-year spike followed by a return to lower rates.
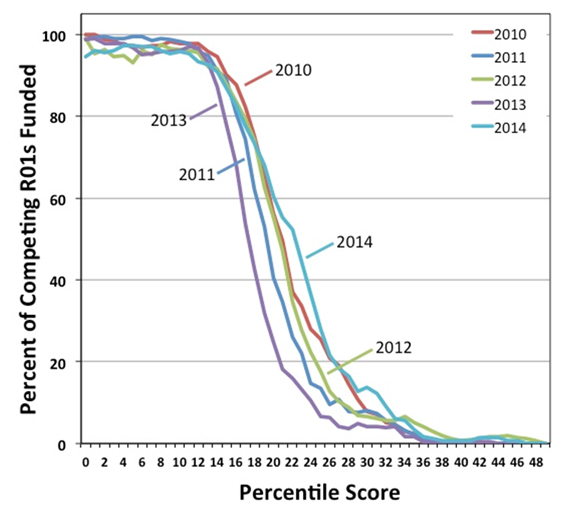
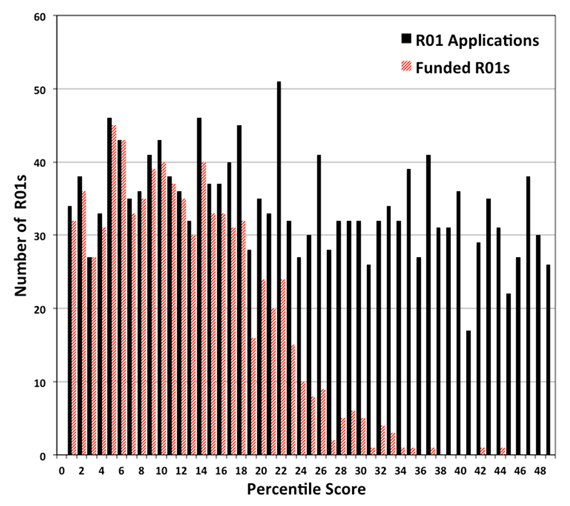
Figures 2 and 3 show data for funding versus the percentile scores of the R01 applications we received. People frequently ask me what NIGMS’ percentile cutoff or “payline” is, but it should be clear from these figures that we do not use a strict percentile score criterion for making funding decisions. Rather, we take a variety of factors into account in addition to the score, including the amount of other support already available to the researcher; the priority of the research area for the Institute’s mission; and the importance of maintaining a broad and diverse portfolio of research topics, approaches and investigators.


It’s too early to say what the success rate will be for Fiscal Year 2015 because it can be influenced by a number of factors, as I described last year. However, we’re hopeful that by continuing to adjust our priorities and policies to focus on supporting a broad and diverse portfolio of investigators, we can reverse the trend of falling success rates seen in recent years.

