
Image Gallery: A molecular interaction network in yeast 3
ID
3733
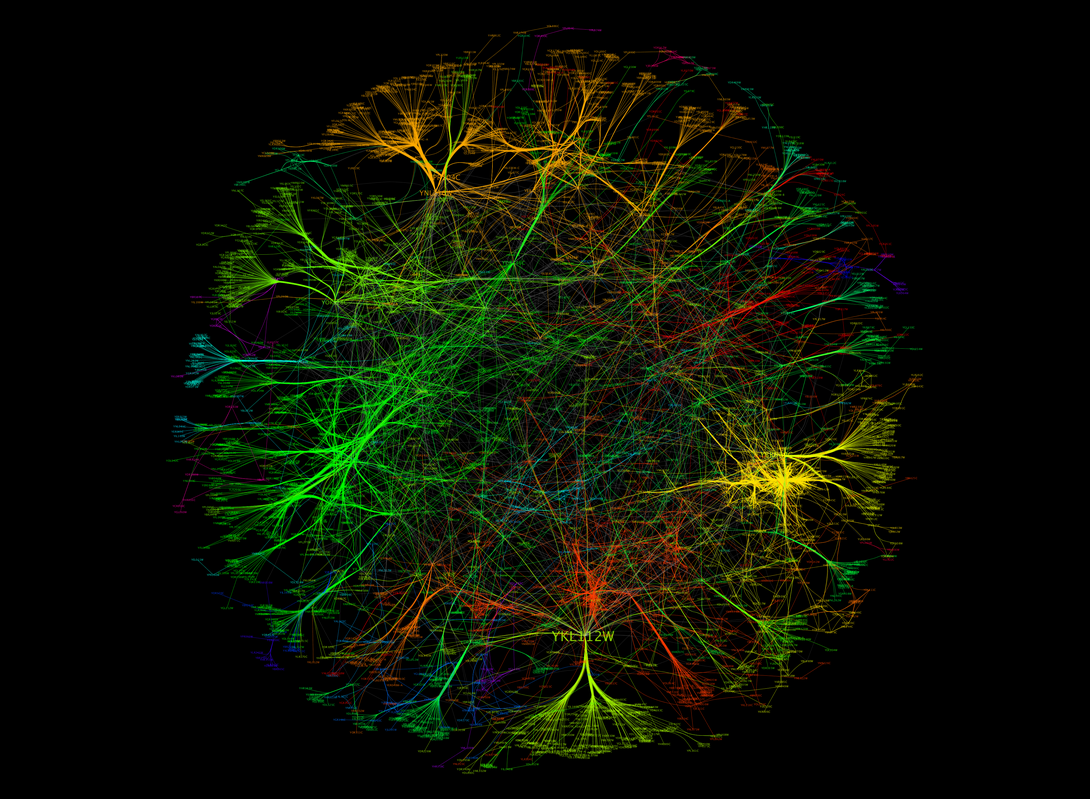
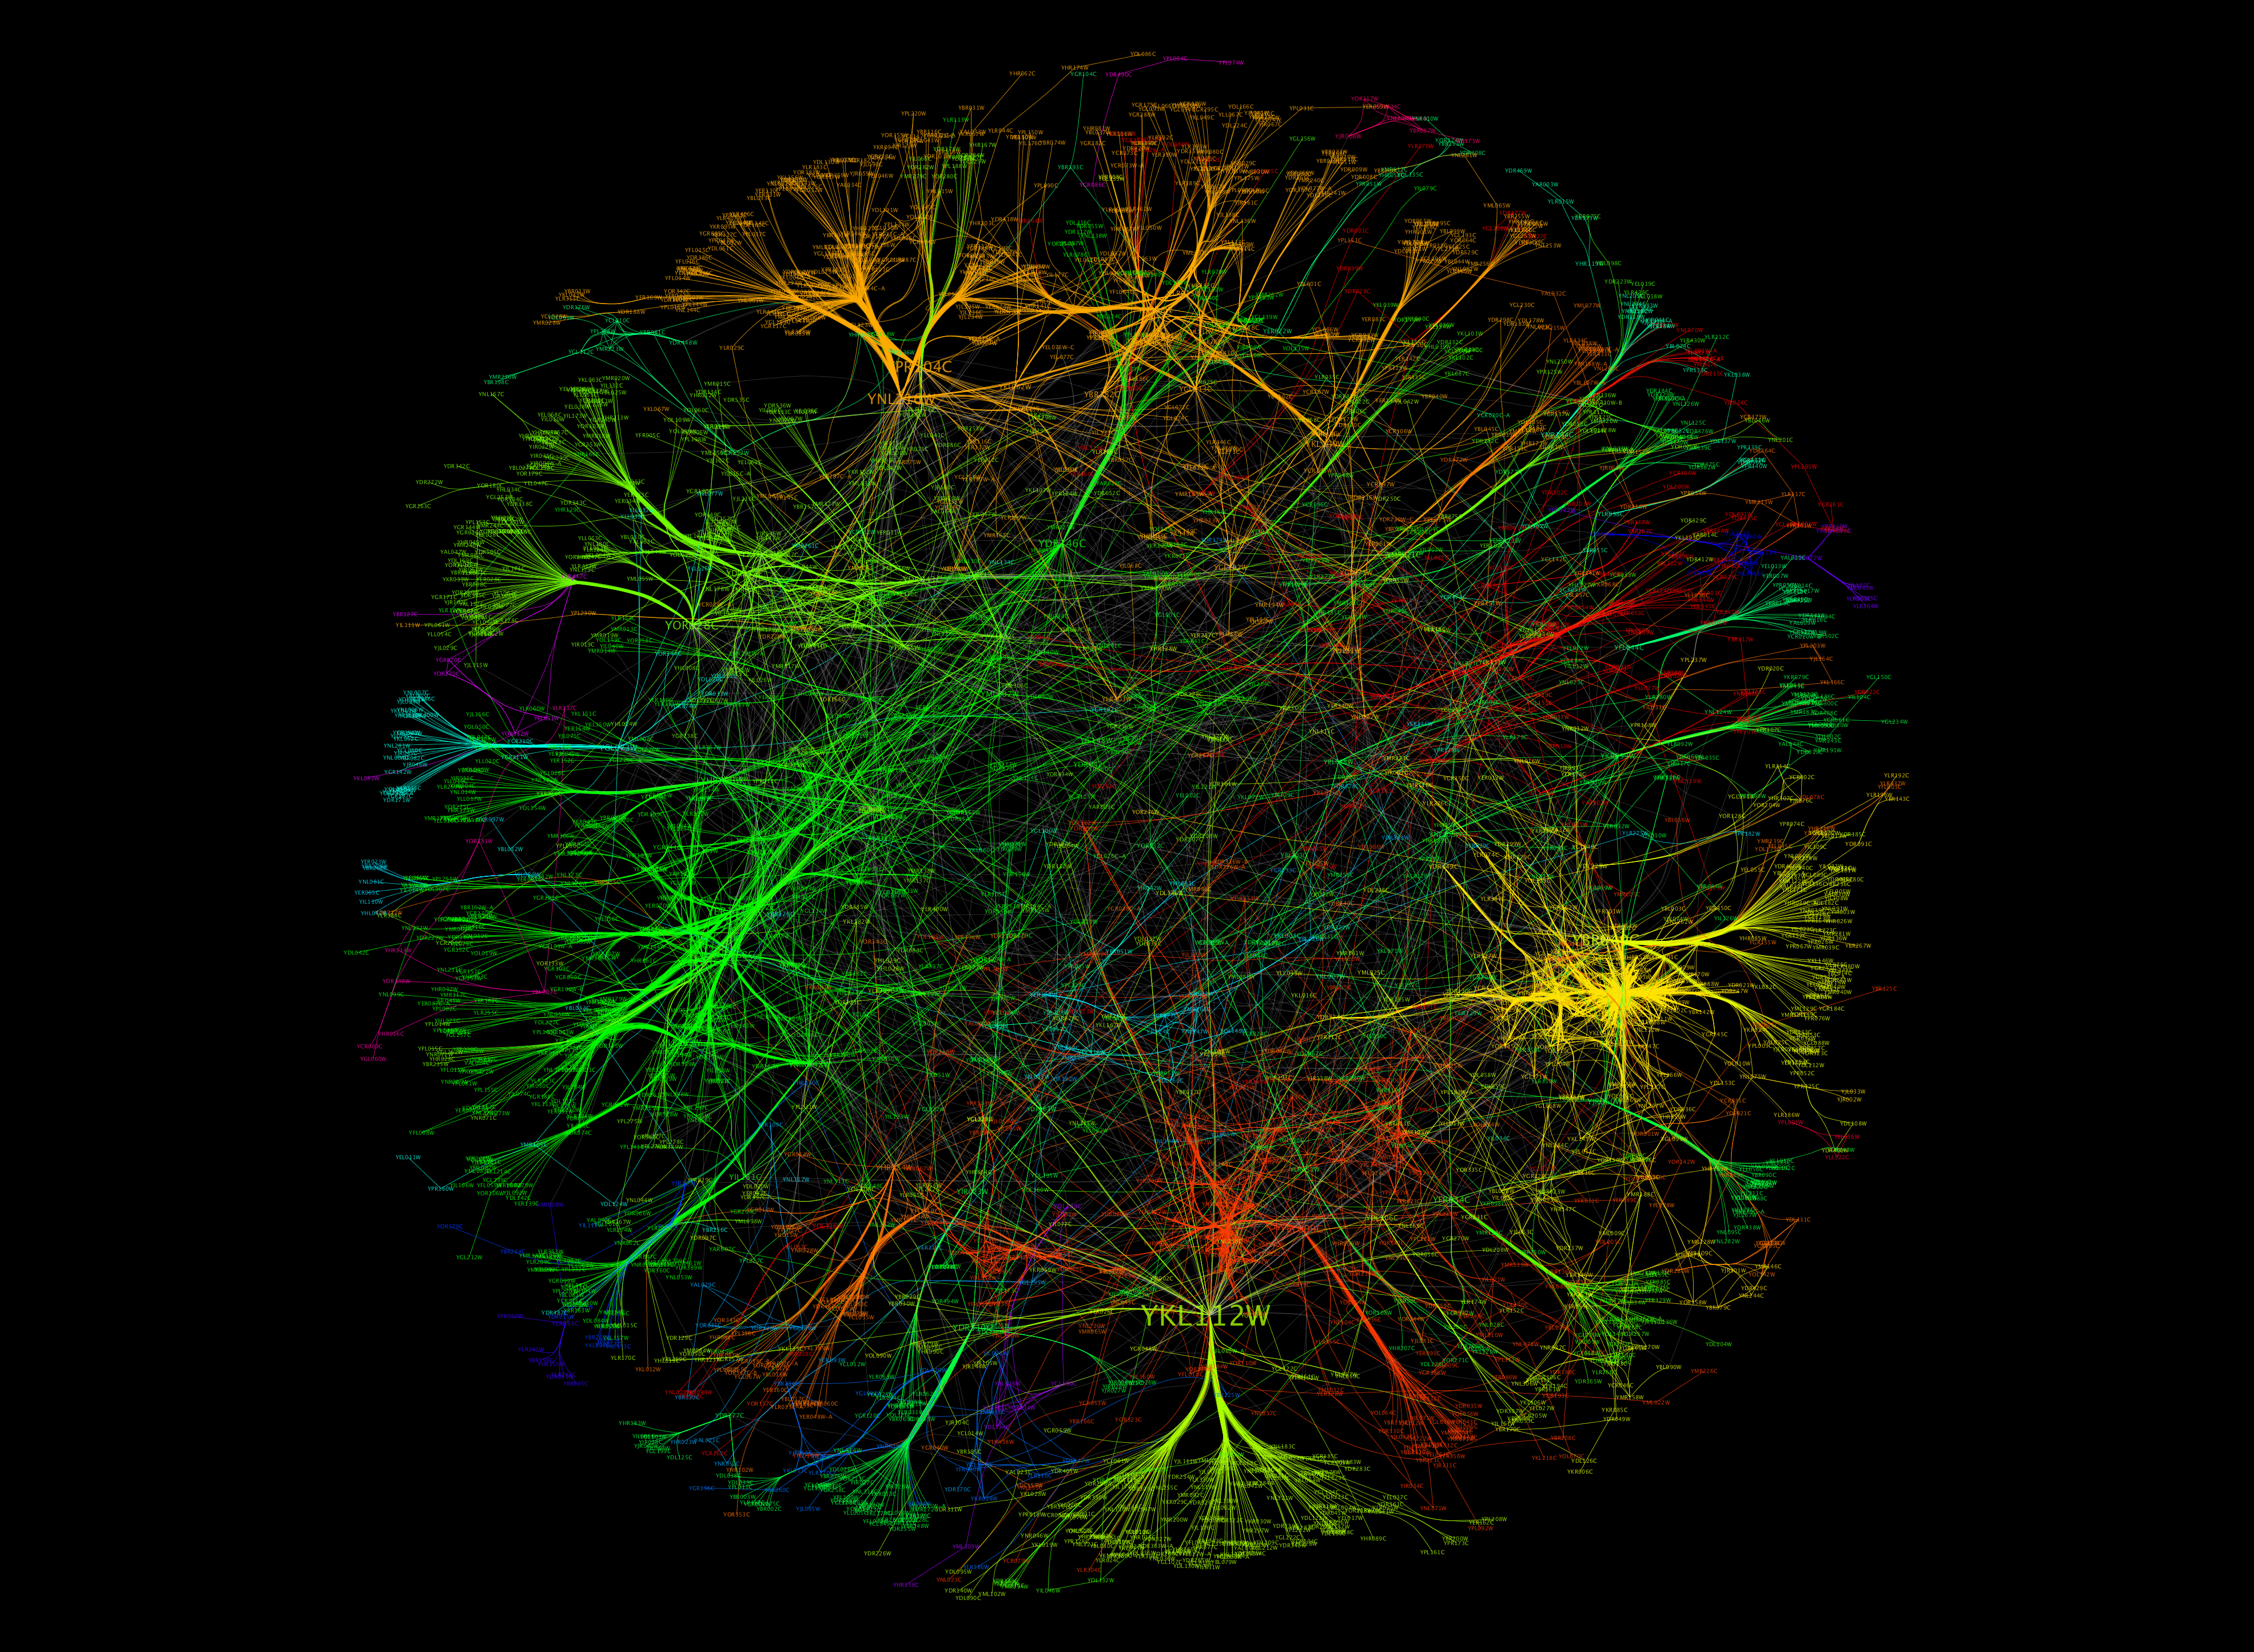
The image visualizes a part of the yeast molecular interaction network. The lines in the network represent connections among genes (shown as little dots) and different-colored networks indicate subnetworks, for instance, those in specific locations or pathways in the cell. Researchers use gene or protein expression data to build these networks; the network shown here was visualized with a program called Cytoscape. By following changes in the architectures of these networks in response to altered environmental conditions, scientists can home in on those genes that become central "hubs" (highly connected genes), for example, when a cell encounters stress. They can then further investigate the precise role of these genes to uncover how a cell's molecular machinery deals with stress or other factors. Related to images 3730 and 3732.
Source
Keiichiro Ono, UCSD
Topics

