
Switch to List View
Image and Video Gallery
This is a searchable collection of scientific photos, illustrations, and videos. The images and videos in this gallery are licensed under Creative Commons Attribution Non-Commercial ShareAlike 3.0. This license lets you remix, tweak, and build upon this work non-commercially, as long as you credit and license your new creations under identical terms.
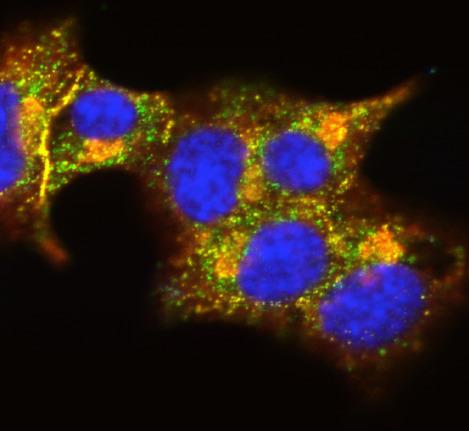
3546: Insulin and protein interact in pancreatic beta cells
3546: Insulin and protein interact in pancreatic beta cells
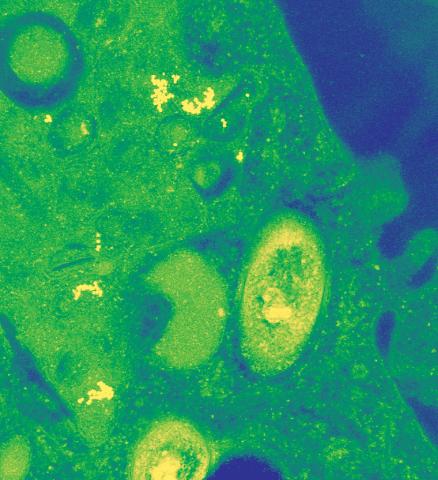
A large number of proteins interact with the hormone insulin as it is produced in and secreted from the beta cells of the pancreas. In this image, the interactions of TMEM24 protein (green) and insulin (red) in pancreatic beta cells are shown in yellow. More information about the research behind this image can be found in a Biomedical Beat Blog posting from November 2013.
William E. Balch, The Scripps Research Institute
View Media
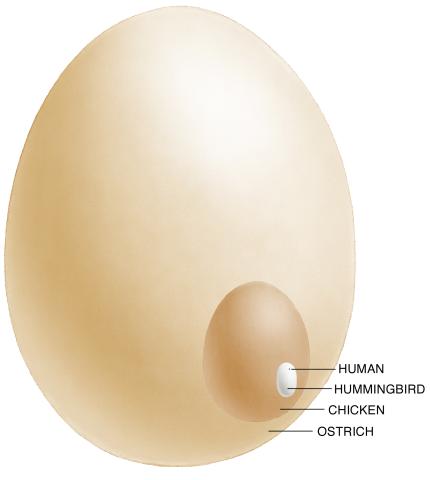
1339: Egg comparison
1339: Egg comparison
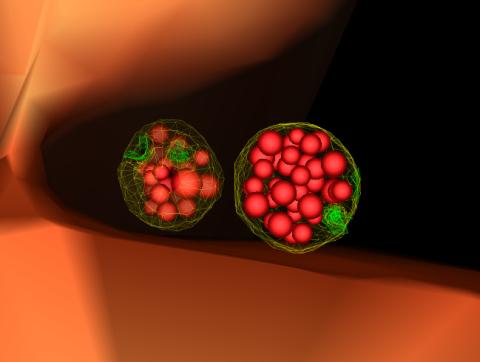
The largest human cell (by volume) is the egg. Human eggs are 150 micrometers in diameter and you can just barely see one with a naked eye. In comparison, consider the eggs of chickens...or ostriches!
Judith Stoffer
View Media
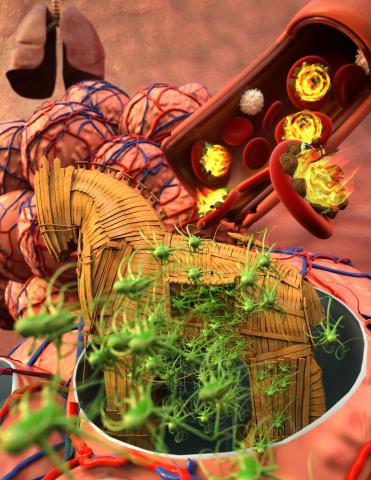
5764: Host infection stimulates antibiotic resistance
5764: Host infection stimulates antibiotic resistance
This illustration shows pathogenic bacteria behave like a Trojan horse: switching from antibiotic susceptibility to resistance during infection. Salmonella are vulnerable to antibiotics while circulating in the blood (depicted by fire on red blood cell) but are highly resistant when residing within host macrophages. This leads to treatment failure with the emergence of drug-resistant bacteria.
This image was chosen as a winner of the 2016 NIH-funded research image call, and the research was funded in part by NIGMS.
View Media
This image was chosen as a winner of the 2016 NIH-funded research image call, and the research was funded in part by NIGMS.
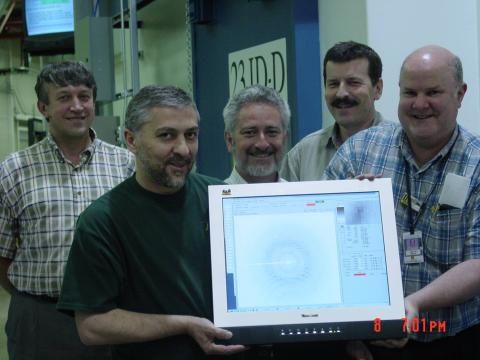
2384: Scientists display X-ray diffraction pattern obtained with split X-ray beamline
2384: Scientists display X-ray diffraction pattern obtained with split X-ray beamline
Scientists from Argonne National Laboratory's Advanced Photon Source (APS) display the first X-ray diffraction pattern obtained from a protein crystal using a split X-ray beam, the first of its kind at APS. The scientists shown are (from left to right): Oleg Makarov, Ruslan Sanishvili, Robert Fischetti (project manager), Sergey Stepanov, and Ward Smith.
GM/CA Collaborative Access Team
View Media
2323: Motion in the brain
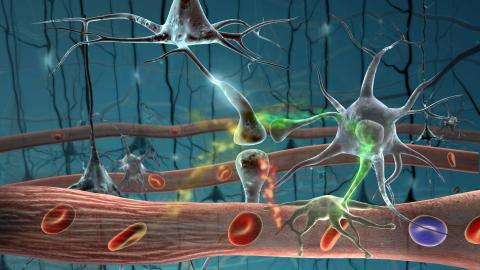
2323: Motion in the brain
Amid a network of blood vessels and star-shaped support cells, neurons in the brain signal each other. The mists of color show the flow of important molecules like glucose and oxygen. This image is a snapshot from a 52-second simulation created by an animation artist. Such visualizations make biological processes more accessible and easier to understand.
Kim Hager and Neal Prakash, University of California, Los Angeles
View Media
2411: Fungal lipase (2)
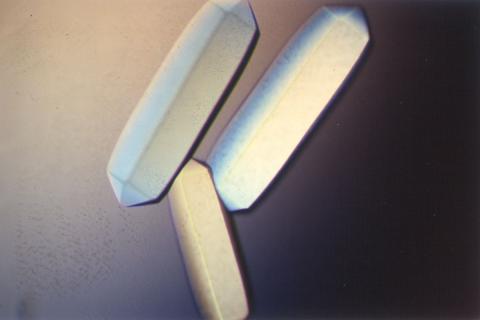
2411: Fungal lipase (2)
Crystals of fungal lipase protein created for X-ray crystallography, which can reveal detailed, three-dimensional protein structures.
Alex McPherson, University of California, Irvine
View Media
2497: Body toxins (with labels)
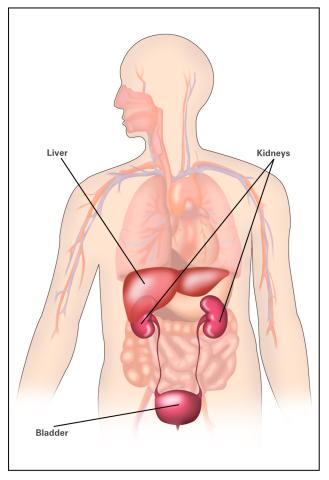
2497: Body toxins (with labels)
Body organs such as the liver and kidneys process chemicals and toxins. These "target" organs are susceptible to damage caused by these substances. See image 2496 for an unlabeled version of this illustration.
Crabtree + Company
View Media
3566: Mouse colon with gut bacteria
3566: Mouse colon with gut bacteria
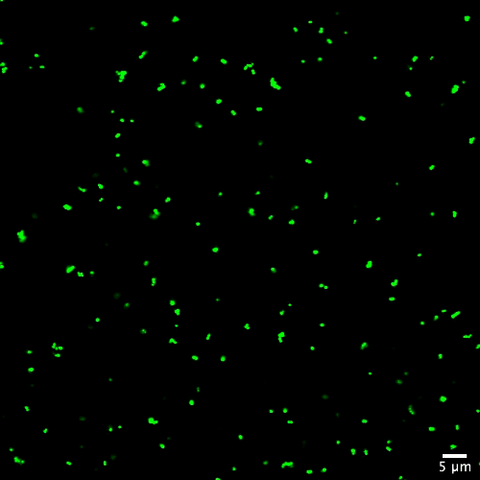
A section of mouse colon with gut bacteria (center, in green) residing within a protective pocket. Understanding how microorganisms colonize the gut could help devise ways to correct for abnormal changes in bacterial communities that are associated with disorders like inflammatory bowel disease.
Sarkis K. Mazmanian, California Institute of Technology
View Media
2793: Anti-tumor drug ecteinascidin 743 (ET-743) with hydrogens 04
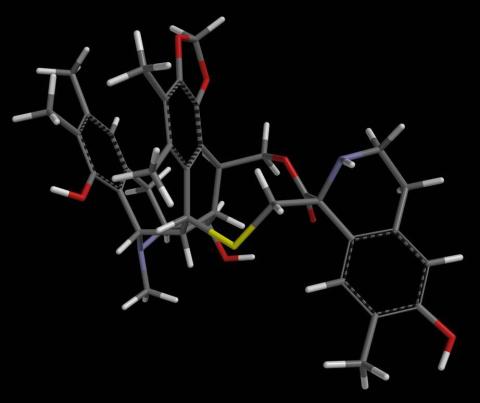
2793: Anti-tumor drug ecteinascidin 743 (ET-743) with hydrogens 04
Ecteinascidin 743 (ET-743, brand name Yondelis), was discovered and isolated from a sea squirt, Ecteinascidia turbinata, by NIGMS grantee Kenneth Rinehart at the University of Illinois. It was synthesized by NIGMS grantees E.J. Corey and later by Samuel Danishefsky. Multiple versions of this structure are available as entries 2790-2797.
Timothy Jamison, Massachusetts Institute of Technology
View Media
3276: Human ES cells differentiating into neurons
3276: Human ES cells differentiating into neurons
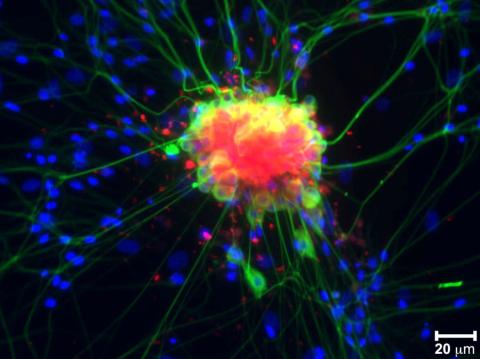
This image shows hundreds of human embryonic stem cells in various stages of differentiating into neurons. Some cells have become neurons (red), while others are still precursors of nerve cells (green). The yellow is an imaging artifact resulting when cells in both stages are on top of each other. Image and caption information courtesy of the California Institute for Regenerative Medicine.
Guoping Fan lab, University of California, Los Angeles, via CIRM
View Media
2397: Bovine milk alpha-lactalbumin (1)
2397: Bovine milk alpha-lactalbumin (1)
A crystal of bovine milk alpha-lactalbumin protein created for X-ray crystallography, which can reveal detailed, three-dimensional protein structures.
Alex McPherson, University of California, Irvine
View Media
6927: Axolotl showing nervous system
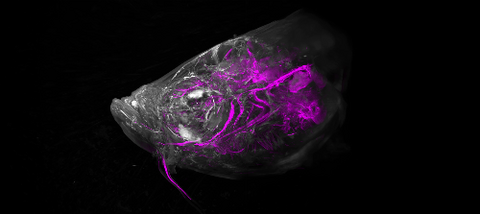
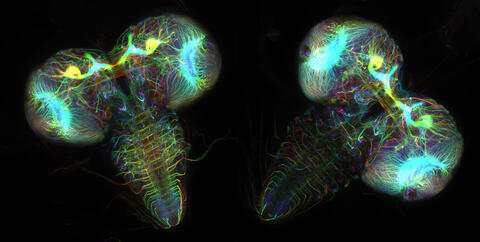
6927: Axolotl showing nervous system
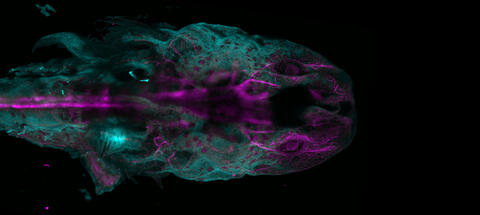
The head of an axolotl—a type of salamander—that has been genetically modified so that its developing nervous system glows purple and its Schwann cell nuclei appear light blue. Schwann cells insulate and provide nutrients to peripheral nerve cells. Researchers often study axolotls for their extensive regenerative abilities. They can regrow tails, limbs, spinal cords, brains, and more. The researcher who took this image focuses on the role of the peripheral nervous system during limb regeneration.
This image was captured using a light sheet microscope.
Related to images 6928 and 6932.
This image was captured using a light sheet microscope.
Related to images 6928 and 6932.
Prayag Murawala, MDI Biological Laboratory and Hannover Medical School.
View Media
6933: Zebrafish head vasculature video
6933: Zebrafish head vasculature video
Various views of a zebrafish head with blood vessels shown in purple. Researchers often study zebrafish because they share many genes with humans, grow and reproduce quickly, and have see-through eggs and embryos, which make it easy to study early stages of development.
This video was captured using a light sheet microscope.
Related to image 6934.
This video was captured using a light sheet microscope.
Related to image 6934.
Prayag Murawala, MDI Biological Laboratory and Hannover Medical School.
View Media
2352: Human aspartoacylase
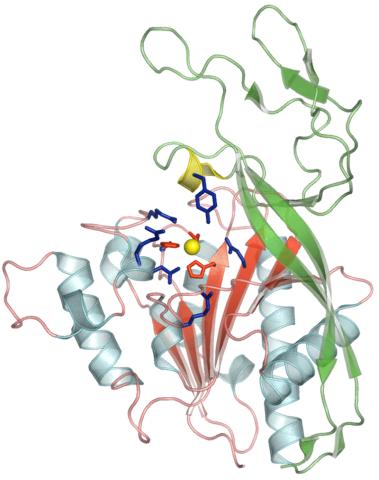
2352: Human aspartoacylase
Model of aspartoacylase, a human enzyme involved in brain metabolism.
Center for Eukaryotic Structural Genomics, PSI
View Media
2498: Cell cycle
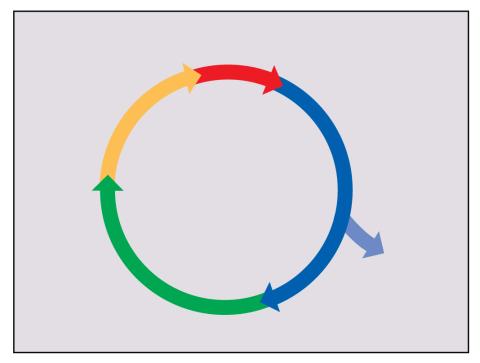
2498: Cell cycle
Cells progress through a cycle that consists of phases for growth (blue, green, yellow) and division (red). Cells become quiescent when they exit this cycle (purple). See image 2499 for a labeled version of this illustration.
Crabtree + Company
View Media
2442: Hydra 06
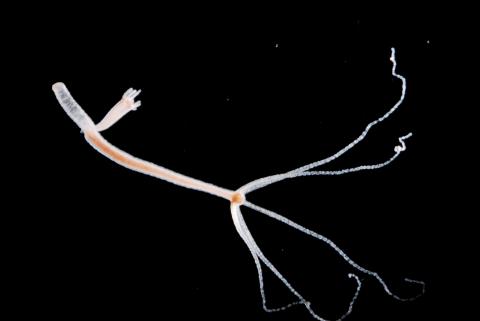
2442: Hydra 06
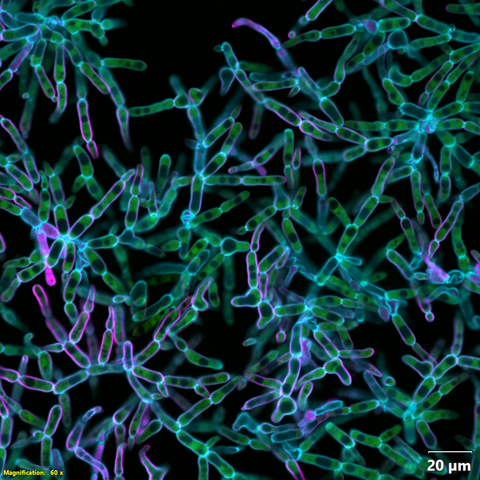
Hydra magnipapillata is an invertebrate animal used as a model organism to study developmental questions, for example the formation of the body axis.
Hiroshi Shimizu, National Institute of Genetics in Mishima, Japan
View Media
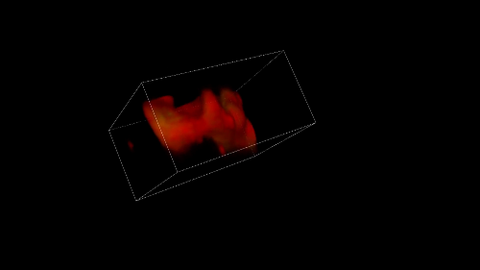
5877: Misfolded proteins in mitochondria, 3-D video
5877: Misfolded proteins in mitochondria, 3-D video
Three-dimensional image of misfolded proteins (green) within mitochondria (red). Related to image 5878. Learn more in this press release by The American Association for the Advancement of Science.
Rong Li, Department of Chemical and Biomolecular Engineering, Whiting School of Engineering, Johns Hopkins University
View Media
6769: Culex quinquefasciatus mosquito larva
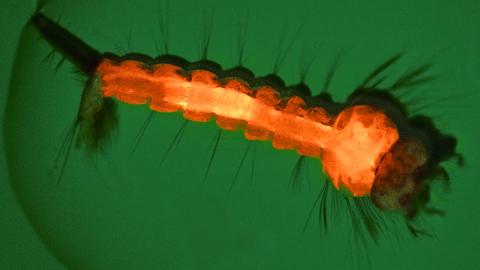
6769: Culex quinquefasciatus mosquito larva
A mosquito larva with genes edited by CRISPR. The red-orange glow is a fluorescent protein used to track the edits. This species of mosquito, Culex quinquefasciatus, can transmit West Nile virus, Japanese encephalitis virus, and avian malaria, among other diseases. The researchers who took this image developed a gene-editing toolkit for Culex quinquefasciatus that could ultimately help stop the mosquitoes from spreading pathogens. The work is described in the Nature Communications paper "Optimized CRISPR tools and site-directed transgenesis towards gene drive development in Culex quinquefasciatus mosquitoes" by Feng et al. Related to image 6770 and video 6771.
Valentino Gantz, University of California, San Diego.
View Media
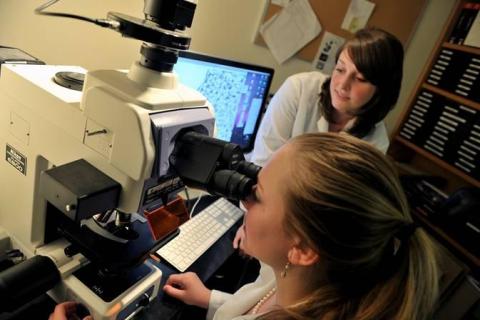
2767: Research mentor and student
2767: Research mentor and student
A research mentor (Lori Eidson) and student (Nina Waldron, on the microscope) were 2009 members of the BRAIN (Behavioral Research Advancements In Neuroscience) program at Georgia State University in Atlanta. This program is an undergraduate summer research experience funded in part by NIGMS.
Elizabeth Weaver, Georgia State University
View Media
2403: Pig trypsin crystal
2403: Pig trypsin crystal
A crystal of pig trypsin protein created for X-ray crystallography, which can reveal detailed, three-dimensional protein structures.
Alex McPherson, University of California, Irvine
View Media
5767: Multivesicular bodies containing intralumenal vesicles assemble at the vacuole 3
5767: Multivesicular bodies containing intralumenal vesicles assemble at the vacuole 3
Collecting and transporting cellular waste and sorting it into recylable and nonrecylable pieces is a complex business in the cell. One key player in that process is the endosome, which helps collect, sort and transport worn-out or leftover proteins with the help of a protein assembly called the endosomal sorting complexes for transport (or ESCRT for short). These complexes help package proteins marked for breakdown into intralumenal vesicles, which, in turn, are enclosed in multivesicular bodies for transport to the places where the proteins are recycled or dumped. In this image, two multivesicular bodies (with yellow membranes) contain tiny intralumenal vesicles (with a diameter of only 25 nanometers; shown in red) adjacent to the cell's vacuole (in orange).
Scientists working with baker's yeast (Saccharomyces cerevisiae) study the budding inward of the limiting membrane (green lines on top of the yellow lines) into the intralumenal vesicles. This tomogram was shot with a Tecnai F-20 high-energy electron microscope, at 29,000x magnification, with a 0.7-nm pixel, ~4-nm resolution.
To learn more about endosomes, see the Biomedical Beat blog post The Cell’s Mailroom. Related to a microscopy photograph 5768 that was used to generate this illustration and a zoomed-out version 5769 of this illustration.
Matthew West and Greg Odorizzi, University of Colorado
View Media
1010: Lily mitosis 10
1010: Lily mitosis 10
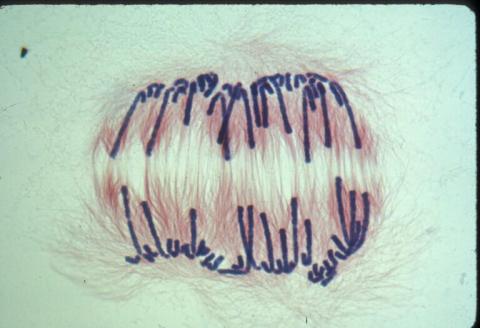
A light microscope image of a cell from the endosperm of an African globe lily (Scadoxus katherinae). This is one frame of a time-lapse sequence that shows cell division in action. The lily is considered a good organism for studying cell division because its chromosomes are much thicker and easier to see than human ones. Staining shows microtubules in red and chromosomes in blue. Here, condensed chromosomes are clearly visible and are separating to form the cores of two new cells.
Related to images 1011, 1012, 1013, 1014, 1015, 1016, 1017, 1018, 1019, and 1021.
Related to images 1011, 1012, 1013, 1014, 1015, 1016, 1017, 1018, 1019, and 1021.
Andrew S. Bajer, University of Oregon, Eugene
View Media
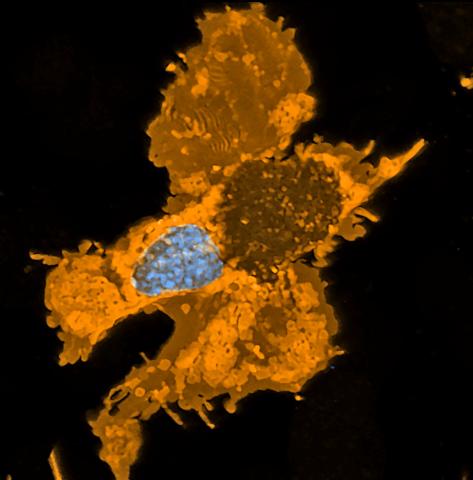
7009: Hungry, hungry macrophages
7009: Hungry, hungry macrophages
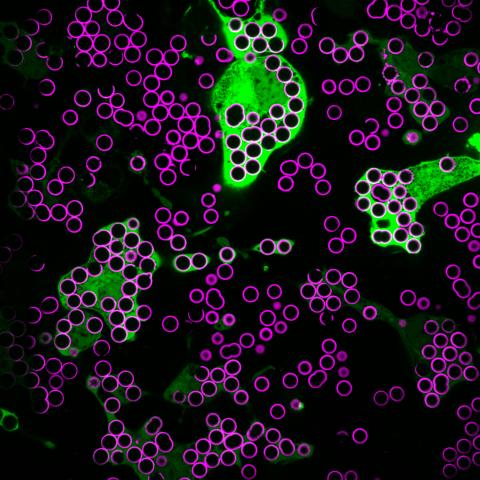
Macrophages (green) are the professional eaters of our immune system. They are constantly surveilling our tissues for targets—such as bacteria, dead cells, or even cancer—and clearing them before they can cause harm. In this image, researchers were testing how macrophages responded to different molecules that were attached to silica beads (magenta) coated with a lipid bilayer to mimic a cell membrane.
Find more information on this image in the NIH Director’s Blog post "How to Feed a Macrophage."
Find more information on this image in the NIH Director’s Blog post "How to Feed a Macrophage."
Meghan Morrissey, University of California, Santa Barbara.
View Media
2542: Nucleotides make up DNA (with labels)
2542: Nucleotides make up DNA (with labels)
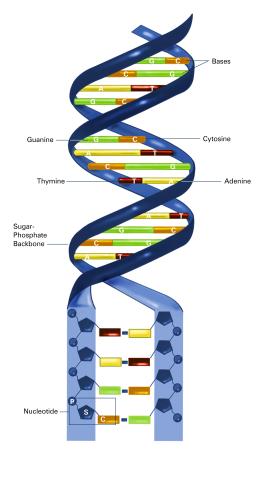
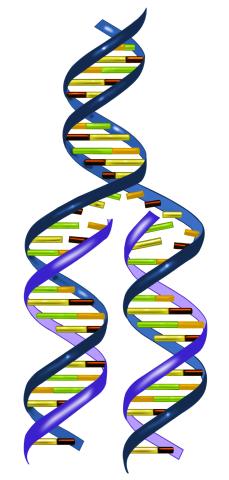
DNA consists of two long, twisted chains made up of nucleotides. Each nucleotide contains one base, one phosphate molecule, and the sugar molecule deoxyribose. The bases in DNA nucleotides are adenine, thymine, cytosine, and guanine. See image 2541 for an unlabeled version of this illustration. Featured in The New Genetics.
Crabtree + Company
View Media
2548: Central dogma, illustrated (with labels)
2548: Central dogma, illustrated (with labels)
DNA encodes RNA, which encodes protein. DNA is transcribed to make messenger RNA (mRNA). The mRNA sequence (dark red strand) is complementary to the DNA sequence (blue strand). On ribosomes, transfer RNA (tRNA) reads three nucleotides at a time in mRNA to bring together the amino acids that link up to make a protein. See image 2549 for a numbered version of this illustration and 2547 for an unlabeled version. Featured in The New Genetics.
Crabtree + Company
View Media
6569: Cryo-electron tomography of a Caulobacter bacterium
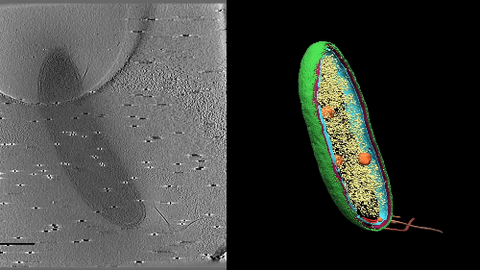
6569: Cryo-electron tomography of a Caulobacter bacterium
3D image of Caulobacter bacterium with various components highlighted: cell membranes (red and blue), protein shell (green), protein factories known as ribosomes (yellow), and storage granules (orange).
Peter Dahlberg, Stanford University.
View Media
3607: Fruit fly ovary
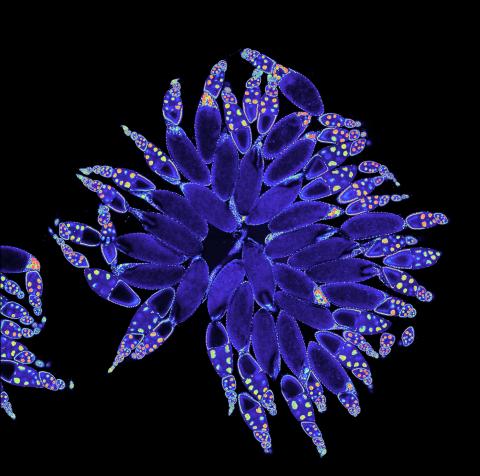
3607: Fruit fly ovary
A fruit fly ovary, shown here, contains as many as 20 eggs. Fruit flies are not merely tiny insects that buzz around overripe fruit—they are a venerable scientific tool. Research on the flies has shed light on many aspects of human biology, including biological rhythms, learning, memory, and neurodegenerative diseases. Another reason fruit flies are so useful in a lab (and so successful in fruit bowls) is that they reproduce rapidly. About three generations can be studied in a single month.
Related to image 3656. This image was part of the Life: Magnified exhibit that ran from June 3, 2014, to January 21, 2015, at Dulles International Airport.
Related to image 3656. This image was part of the Life: Magnified exhibit that ran from June 3, 2014, to January 21, 2015, at Dulles International Airport.
Denise Montell, Johns Hopkins University and University of California, Santa Barbara
View Media
2763: Fused, dicentric chromosomes
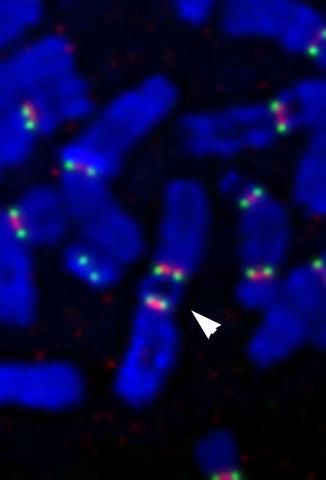
2763: Fused, dicentric chromosomes
This fused chromosome has two functional centromeres, shown as two sets of red and green dots. Centromeres are DNA/protein complexes that are key to splitting the chromosomes evenly during cell division. When dicentric chromosomes like this one are formed in a person, fertility problems or other difficulties may arise. Normal chromosomes carrying a single centromere (one set of red and green dots) are also visible in this image.
Beth A. Sullivan, Duke University
View Media
2395: Fungal lipase (1)
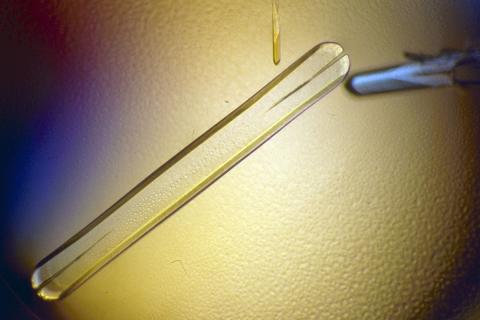
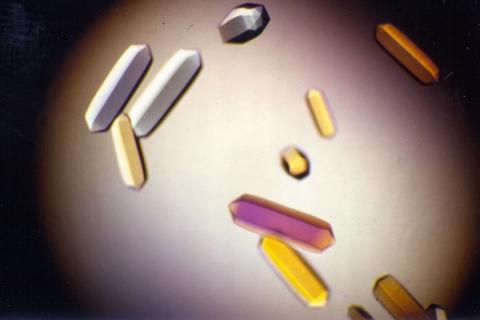
2395: Fungal lipase (1)
Crystals of fungal lipase protein created for X-ray crystallography, which can reveal detailed, three-dimensional protein structures.
Alex McPherson, University of California, Irvine
View Media
3742: Confocal microscopy of perineuronal nets in the brain 2
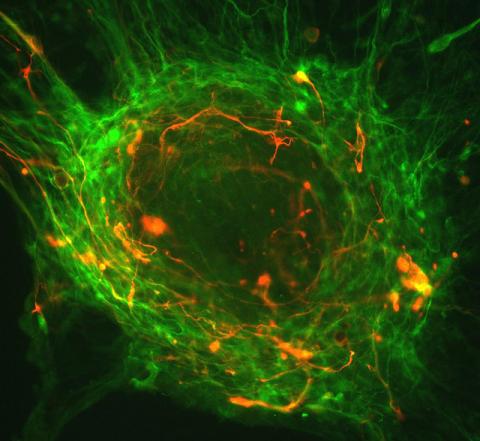
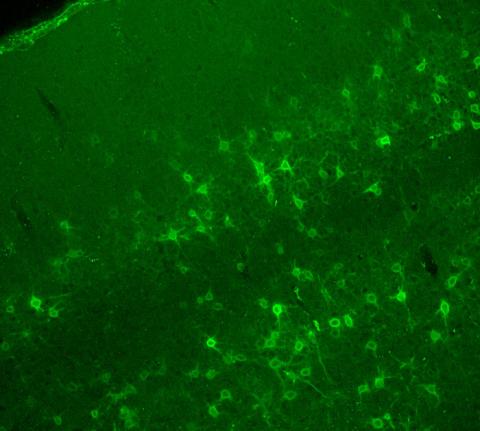
3742: Confocal microscopy of perineuronal nets in the brain 2
The photo shows a confocal microscopy image of perineuronal nets (PNNs), which are specialized extracellular matrix (ECM) structures in the brain. The PNN surrounds some nerve cells in brain regions including the cortex, hippocampus and thalamus. Researchers study the PNN to investigate their involvement stabilizing the extracellular environment and forming nets around nerve cells and synapses in the brain. Abnormalities in the PNNs have been linked to a variety of disorders, including epilepsy and schizophrenia, and they limit a process called neural plasticity in which new nerve connections are formed. To visualize the PNNs, researchers labeled them with Wisteria floribunda agglutinin (WFA)-fluorescein. Related to image 3741.
Tom Deerinck, National Center for Microscopy and Imaging Research (NCMIR)
View Media
1247: Crab nerve cell
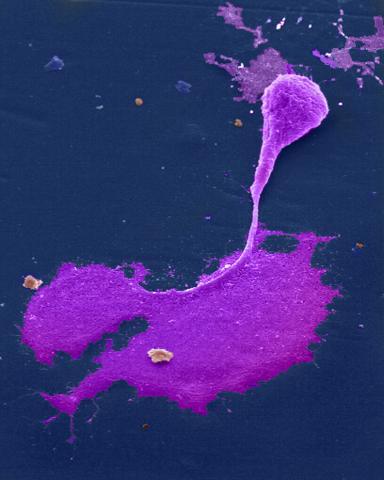
1247: Crab nerve cell
Neuron from a crab showing the cell body (bottom), axon (rope-like extension), and growth cone (top right).
Tina Weatherby Carvalho, University of Hawaii at Manoa
View Media
3677: Human skeletal muscle
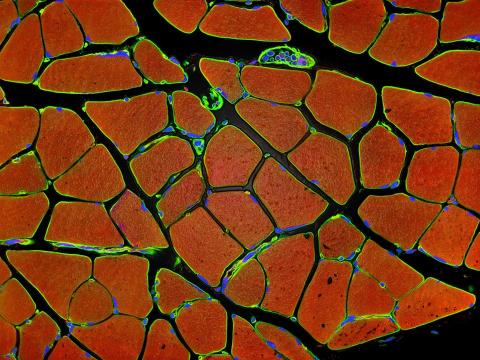
3677: Human skeletal muscle
Cross section of human skeletal muscle. Image taken with a confocal fluorescent light microscope.
Tom Deerinck, National Center for Microscopy and Imaging Research (NCMIR)
View Media
5857: 3D reconstruction of a tubular matrix in peripheral endoplasmic reticulum
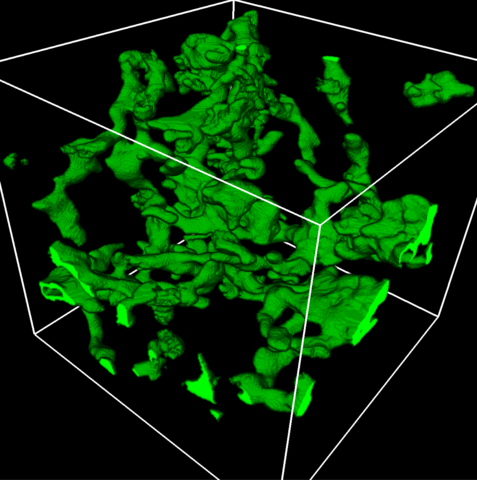
5857: 3D reconstruction of a tubular matrix in peripheral endoplasmic reticulum
Detailed three-dimensional reconstruction of a tubular matrix in a thin section of the peripheral endoplasmic reticulum between the plasma membranes of the cell. The endoplasmic reticulum (ER) is a continuous membrane that extends like a net from the envelope of the nucleus outward to the cell membrane. The ER plays several roles within the cell, such as in protein and lipid synthesis and transport of materials between organelles. Shown here is a three-dimensional representation of the peripheral ER microtubules. Related to images 5855 and 5856
Jennifer Lippincott-Schwartz, Howard Hughes Medical Institute Janelia Research Campus, Virginia
View Media
3542: Structure of amyloid-forming prion protein
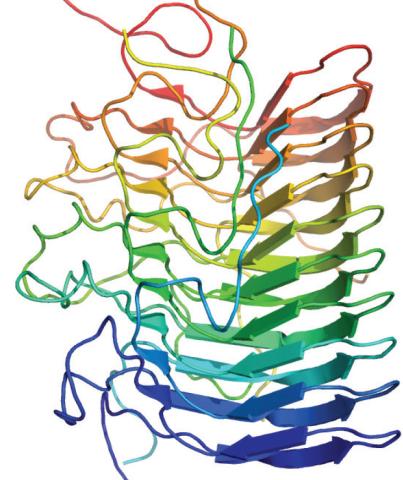
3542: Structure of amyloid-forming prion protein
This structure from an amyloid-forming prion protein shows one way beta sheets can stack. Image originally appeared in a December 2012 PLOS Biology paper.
Douglas Fowler, University of Washington
View Media
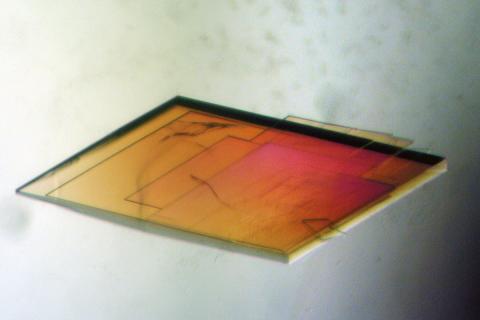
1070: Microarray 01
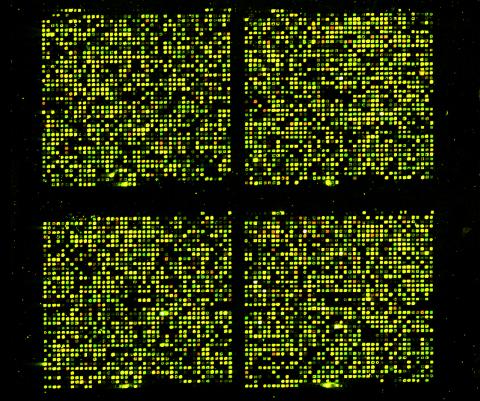
1070: Microarray 01
Microarrays, also called gene chips, are tools that let scientists track the activity of hundreds or thousands of genes simultaneously. For example, researchers can compare the activities of genes in healthy and diseased cells, allowing the scientists to pinpoint which genes and cell processes might be involved in the development of a disease.
Maggie Werner-Washburne, University of New Mexico, Albuquerque
View Media
2451: Seeing signaling protein activation in cells 01
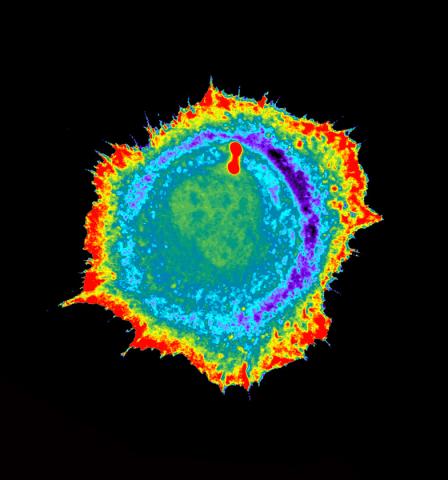
2451: Seeing signaling protein activation in cells 01
Cdc42, a member of the Rho family of small guanosine triphosphatase (GTPase) proteins, regulates multiple cell functions, including motility, proliferation, apoptosis, and cell morphology. In order to fulfill these diverse roles, the timing and location of Cdc42 activation must be tightly controlled. Klaus Hahn and his research group use special dyes designed to report protein conformational changes and interactions, here in living neutrophil cells. Warmer colors in this image indicate higher levels of activation. Cdc42 looks to be activated at cell protrusions.
Related to images 2452, 2453, and 2454.
Related to images 2452, 2453, and 2454.
Klaus Hahn, University of North Carolina, Chapel Hill Medical School
View Media
3400: Small blood vessels in a mouse retina
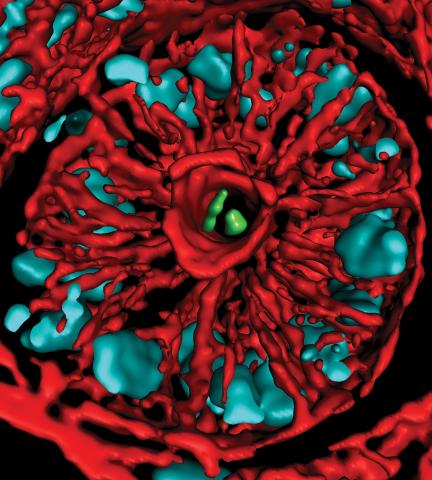
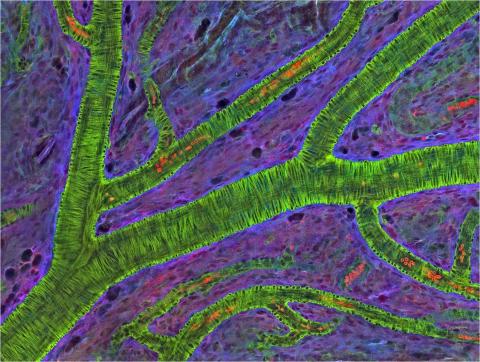
3400: Small blood vessels in a mouse retina
Blood vessels at the back of the eye (retina) are used to diagnose glaucoma and diabetic eye disease. They also display characteristic changes in people with high blood pressure. In the image, the vessels appear green. It's not actually the vessels that are stained green, but rather filaments of a protein called actin that wraps around the vessels. Most of the red blood cells were replaced by fluid as the tissue was prepared for the microscope. The tiny red dots are red blood cells that remain in the vessels. The image was captured using confocal and 2-photon excitation microscopy for a project related to neurofibromatosis.
National Center for Microscopy and Imaging Research
View Media
5754: Zebrafish pigment cell
5754: Zebrafish pigment cell
Pigment cells are cells that give skin its color. In fishes and amphibians, like frogs and salamanders, pigment cells are responsible for the characteristic skin patterns that help these organisms to blend into their surroundings or attract mates. The pigment cells are derived from neural crest cells, which are cells originating from the neural tube in the early embryo. Investigating pigment cell formation and migration in animals helps answer important fundamental questions about the factors that control pigmentation in the skin of animals, including humans. This image shows a pigment cell from zebrafish at high resolution. Related to images 5755, 5756, 5757 and 5758.
David Parichy, University of Washington
View Media
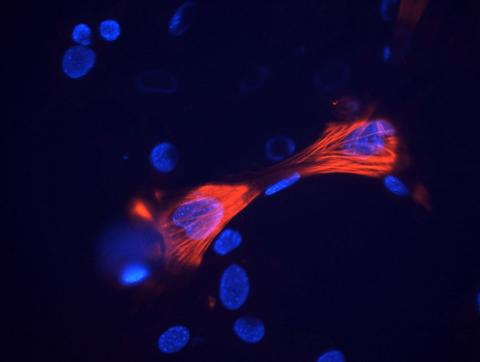
3289: Smooth muscle from mouse stem cells
3289: Smooth muscle from mouse stem cells
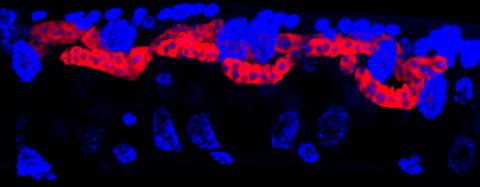
These smooth muscle cells were derived from mouse neural crest stem cells. Red indicates smooth muscle proteins, blue indicates nuclei. Image and caption information courtesy of the California Institute for Regenerative Medicine.
Deepak Srivastava, Gladstone Institutes, via CIRM
View Media
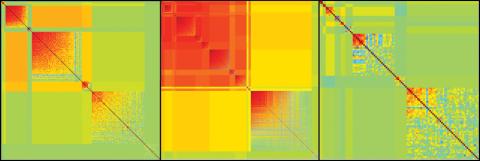
2588: Genetic patchworks
2588: Genetic patchworks
Each point in these colorful patchworks represents the correlation between two sleep-associated genes in fruit flies. Vibrant reds and oranges represent high and intermediate degrees of association between the genes, respectively. Genes in these areas show similar activity patterns in different fly lines. Cool blues represent gene pairs where one partner's activity is high and the other's is low. The green areas show pairs with activities that are not correlated. These quilt-like depictions help illustrate a recent finding that genes act in teams to influence sleep patterns.
Susan Harbison and Trudy Mackay, North Carolina State University
View Media
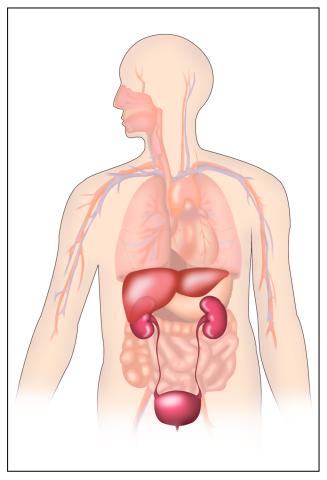
2496: Body toxins
2496: Body toxins
Body organs such as the liver and kidneys process chemicals and toxins. These "target" organs are susceptible to damage caused by these substances. See image 2497 for a labeled version of this illustration.
Crabtree + Company
View Media
6891: Microtubules in African green monkey cells
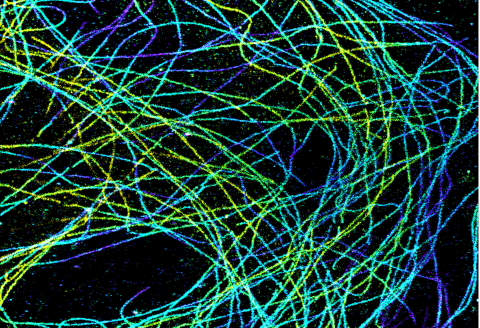
6891: Microtubules in African green monkey cells
Microtubules in African green monkey cells. Microtubules are strong, hollow fibers that provide cells with structural support. Here, the microtubules have been color-coded based on their distance from the microscope lens: purple is closest to the lens, and yellow is farthest away. This image was captured using Stochastic Optical Reconstruction Microscopy (STORM).
Related to images 6889, 6890, and 6892.
Related to images 6889, 6890, and 6892.
Melike Lakadamyali, Perelman School of Medicine at the University of Pennsylvania.
View Media
2716: Mycobacterium tuberculosis
2716: Mycobacterium tuberculosis
Mycobacterium tuberculosis, the bacterium that causes tuberculosis, has infected one-quarter of the world's population and causes more than one million deaths each year, according to the World Health Organization.
Reuben Peters, Iowa State University
View Media
2543: DNA replication illustration
2543: DNA replication illustration
During DNA replication, each strand of the original molecule acts as a template for the synthesis of a new, complementary DNA strand. See image 2544 for a labeled version of this illustration.
Crabtree + Company
View Media
6970: Snowflake yeast 2
6970: Snowflake yeast 2
Multicellular yeast called snowflake yeast that researchers created through many generations of directed evolution from unicellular yeast. Cells are connected to one another by their cell walls, shown in blue. Stained cytoplasm (green) and membranes (magenta) show that the individual cells remain separate. This image was captured using spinning disk confocal microscopy.
Related to images 6969 and 6971.
Related to images 6969 and 6971.
William Ratcliff, Georgia Institute of Technology.
View Media
6808: Fruit fly larvae brains showing tubulin
6808: Fruit fly larvae brains showing tubulin
Two fruit fly (Drosophila melanogaster) larvae brains with neurons expressing fluorescently tagged tubulin protein. Tubulin makes up strong, hollow fibers called microtubules that play important roles in neuron growth and migration during brain development. This image was captured using confocal microscopy, and the color indicates the position of the neurons within the brain.
Vladimir I. Gelfand, Feinberg School of Medicine, Northwestern University.
View Media
6805: Staphylococcus aureus aggregating upon contact with synovial fluid
6805: Staphylococcus aureus aggregating upon contact with synovial fluid
Staphylococcus aureus bacteria (green) grouping together upon contact with synovial fluid—a viscous substance found in joints. The formation of groups can help protect the bacteria from immune system defenses and from antibiotics, increasing the likelihood of an infection. This video is a 1-hour time lapse and was captured using a confocal laser scanning microscope.
More information about the research that produced this video can be found in the Journal of Bacteriology paper "In Vitro Staphylococcal Aggregate Morphology and Protection from Antibiotics Are Dependent on Distinct Mechanisms Arising from Postsurgical Joint Components and Fluid Motion" by Staats et al.
Related to images 6803 and 6804.
Paul Stoodley, The Ohio State University.
View Media
5779: Microsporidia in roundworm 3
5779: Microsporidia in roundworm 3
Many disease-causing microbes manipulate their host’s metabolism and cells for their own ends. Microsporidia—which are parasites closely related to fungi—infect and multiply inside animal cells, and take the rearranging of cells’ interiors to a new level. They reprogram animal cells such that the cells start to fuse, causing them to form long, continuous tubes. As shown in this image of the roundworm Caenorhabditis elegans, microsporidia (shown in red) have invaded the worm’s gut cells (the large blue dots are the cells' nuclei) and have instructed the cells to merge. The cell fusion enables the microsporidia to thrive and propagate in the expanded space. Scientists study microsporidia in worms to gain more insight into how these parasites manipulate their host cells. This knowledge might help researchers devise strategies to prevent or treat infections with microsporidia.
For more on the research into microsporidia, see this news release from the University of California San Diego. Related to images 5777 and 5778.
For more on the research into microsporidia, see this news release from the University of California San Diego. Related to images 5777 and 5778.
Keir Balla and Emily Troemel, University of California San Diego
View Media
3251: Spinal nerve cells
3251: Spinal nerve cells
Neurons (green) and glial cells from isolated dorsal root ganglia express COX-2 (red) after exposure to an inflammatory stimulus (cell nuclei are blue). Lawrence Marnett and colleagues have demonstrated that certain drugs selectively block COX-2 metabolism of endocannabinoids -- naturally occurring analgesic molecules -- in stimulated dorsal root ganglia. Featured in the October 20, 2011 issue of Biomedical Beat.
Lawrence Marnett, Vanderbilt University
View Media

6521: Yeast art depicting the New York City skyline
6521: Yeast art depicting the New York City skyline
This skyline of New York City was created by “printing” nanodroplets containing yeast (Saccharomyces cerevisiae) onto a large plate. Each dot is a separate yeast colony. As the colonies grew, a picture emerged, creating art. To make the different colors shown here, yeast strains were genetically engineered to produce pigments naturally made by bacteria, fungi, and sea creatures such as coral and sea anemones. Using genes from other organisms to make biological compounds paves the way toward harnessing yeast in the production of other useful molecules, from food to fuels and drugs.
Michael Shen, Ph.D., Jasmine Temple, Leslie Mitchell, Ph.D., and Jef Boeke, Ph.D., New York University School of Medicine; and Nick Phillips, James Chuang, Ph.D., and Jiarui Wang, Johns Hopkins University.
View Media