 National Institute of

Switch to List View
Image and Video Gallery
This is a searchable collection of scientific photos, illustrations, and videos. The images and videos in this gallery are licensed under Creative Commons Attribution Non-Commercial ShareAlike 3.0. This license lets you remix, tweak, and build upon this work non-commercially, as long as you credit and license your new creations under identical terms.
2433: Fruit fly sperm cells
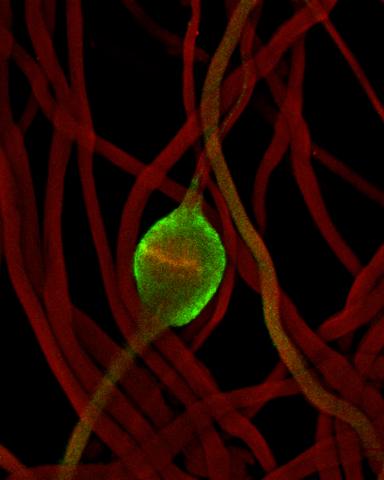
2433: Fruit fly sperm cells
Developing fruit fly spermatids require caspase activity (green) for the elimination of unwanted organelles and cytoplasm via apoptosis.
Hermann Steller, Rockefeller University
View Media
5751: Genetically identical mycobacteria respond differently to antibiotic 1
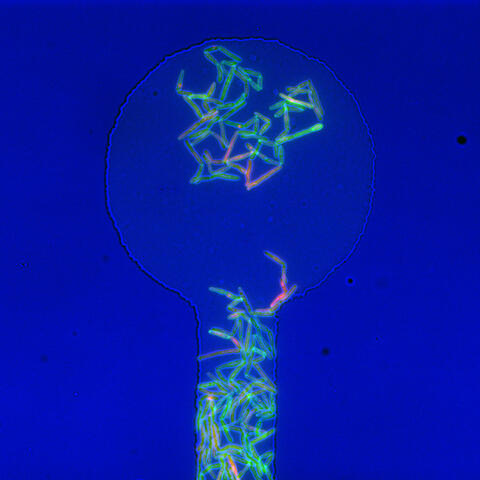
5751: Genetically identical mycobacteria respond differently to antibiotic 1
Antibiotic resistance in microbes is a serious health concern. So researchers have turned their attention to how bacteria undo the action of some antibiotics. Here, scientists set out to find the conditions that help individual bacterial cells survive in the presence of the antibiotic rifampicin. The research team used Mycobacterium smegmatis, a more harmless relative of Mycobacterium tuberculosis, which infects the lung and other organs and causes serious disease.
In this image, genetically identical mycobacteria are growing in a miniature growth chamber called a microfluidic chamber. Using live imaging, the researchers found that individual mycobacteria will respond differently to the antibiotic, depending on the growth stage and other timing factors. The researchers used genetic tagging with green fluorescent protein to distinguish cells that can resist rifampicin and those that cannot. With this gene tag, cells tolerant of the antibiotic light up in green and those that are susceptible in violet, enabling the team to monitor the cells' responses in real time.
To learn more about how the researchers studied antibiotic resistance in mycobacteria, see this news release from Tufts University. Related to video 5752.
In this image, genetically identical mycobacteria are growing in a miniature growth chamber called a microfluidic chamber. Using live imaging, the researchers found that individual mycobacteria will respond differently to the antibiotic, depending on the growth stage and other timing factors. The researchers used genetic tagging with green fluorescent protein to distinguish cells that can resist rifampicin and those that cannot. With this gene tag, cells tolerant of the antibiotic light up in green and those that are susceptible in violet, enabling the team to monitor the cells' responses in real time.
To learn more about how the researchers studied antibiotic resistance in mycobacteria, see this news release from Tufts University. Related to video 5752.
Bree Aldridge, Tufts University
View Media
3306: Planarian stem cell colony
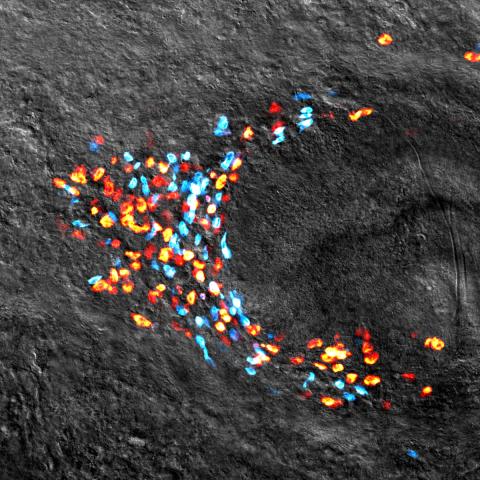
3306: Planarian stem cell colony
Planarians are freshwater flatworms that have powerful abilities to regenerate their bodies, which would seem to make them natural model organisms in which to study stem cells. But until recently, scientists had not been able to efficiently find the genes that regulate the planarian stem cell system. In this image, a single stem cell has given rise to a colony of stem cells in a planarian. Proliferating cells are red, and differentiating cells are blue. Quantitatively measuring the size and ratios of these two cell types provides a powerful framework for studying the roles of stem cell regulatory genes in planarians.
Peter Reddien, Whitehead Institute
View Media
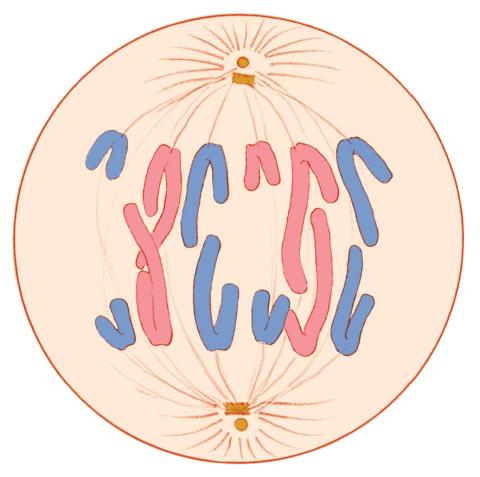
1328: Mitosis - anaphase
1328: Mitosis - anaphase
A cell in anaphase during mitosis: Chromosomes separate into two genetically identical groups and move to opposite ends of the spindle. Mitosis is responsible for growth and development, as well as for replacing injured or worn out cells throughout the body. For simplicity, mitosis is illustrated here with only six chromosomes.
Judith Stoffer
View Media
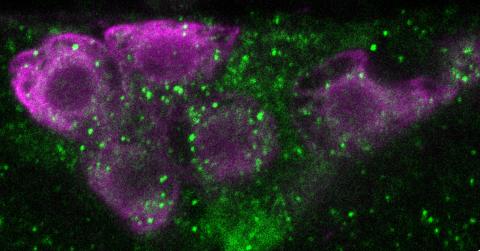
6982: Insulin production and fat sensing in fruit flies
6982: Insulin production and fat sensing in fruit flies
Fourteen neurons (magenta) in the adult Drosophila brain produce insulin, and fat tissue sends packets of lipids to the brain via the lipoprotein carriers (green). This image was captured using a confocal microscope and shows a maximum intensity projection of many slices.
Related to images 6983, 6984, and 6985.
Related to images 6983, 6984, and 6985.
Akhila Rajan, Fred Hutchinson Cancer Center
View Media
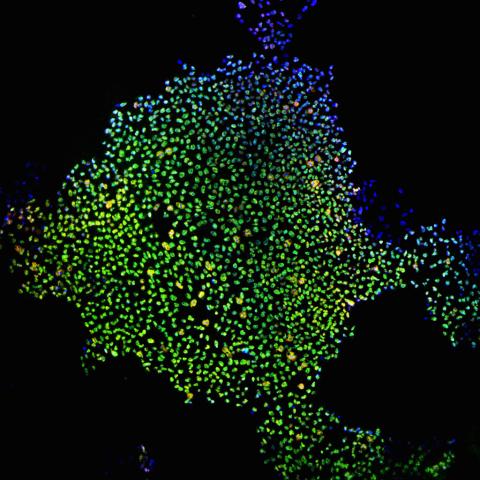
2604: Induced stem cells from adult skin 02
2604: Induced stem cells from adult skin 02
These cells are induced stem cells made from human adult skin cells that were genetically reprogrammed to mimic embryonic stem cells. The induced stem cells were made potentially safer by removing the introduced genes and the viral vector used to ferry genes into the cells, a loop of DNA called a plasmid. The work was accomplished by geneticist Junying Yu in the laboratory of James Thomson, a University of Wisconsin-Madison School of Medicine and Public Health professor and the director of regenerative biology for the Morgridge Institute for Research.
James Thomson, University of Wisconsin-Madison
View Media
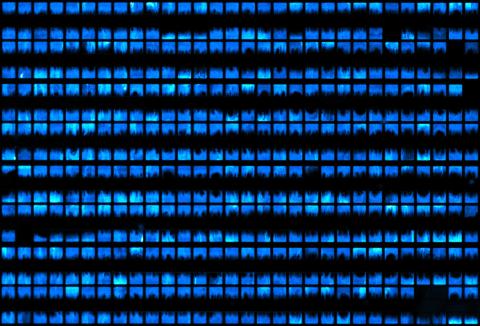
3266: Biopixels
3266: Biopixels
Bioengineers were able to coax bacteria to blink in unison on microfluidic chips. This image shows a small chip with about 500 blinking bacterial colonies or biopixels. Related to images 3265 and 3268. From a UC San Diego news release, "Researchers create living 'neon signs' composed of millions of glowing bacteria."
Jeff Hasty Lab, UC San Diego
View Media
3297: Four timepoints in gastrulation
3297: Four timepoints in gastrulation
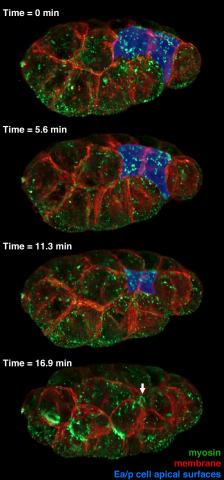
It has been said that gastrulation is the most important event in a person's life. This part of early embryonic development transforms a simple ball of cells and begins to define cell fate and the body axis. In a study published in Science magazine in March 2012, NIGMS grantee Bob Goldstein and his research group studied how contractions of actomyosin filaments in C. elegans and Drosophila embryos lead to dramatic rearrangements of cell and embryonic structure. This research is described in detail in the following article: "Triggering a Cell Shape Change by Exploiting Preexisting Actomyosin Contractions." In these images, myosin (green) and plasma membrane (red) are highlighted at four timepoints in gastrulation in the roundworm C. elegans. The blue highlights in the top three frames show how cells are internalized, and the site of closure around the involuting cells is marked with an arrow in the last frame. See related video 3334.
Bob Goldstein, University of North Carolina, Chapel Hill
View Media
3498: Wound healing in process
3498: Wound healing in process
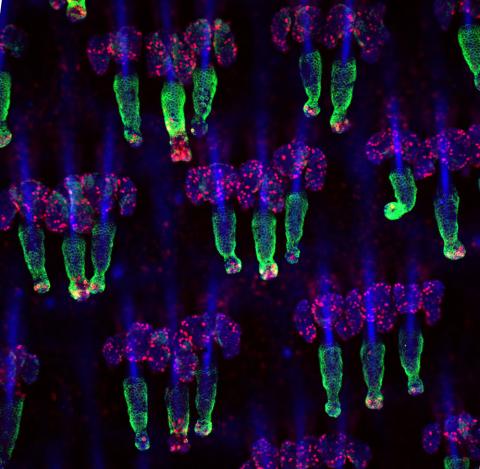
Wound healing requires the action of stem cells. In mice that lack the Sept2/ARTS gene, stem cells involved in wound healing live longer and wounds heal faster and more thoroughly than in normal mice. This confocal microscopy image from a mouse lacking the Sept2/ARTS gene shows a tail wound in the process of healing. See more information in the article in Science.
Related to images 3497 and 3500.
Related to images 3497 and 3500.
Hermann Steller, Rockefeller University
View Media
3282: Mouse heart muscle cells
3282: Mouse heart muscle cells
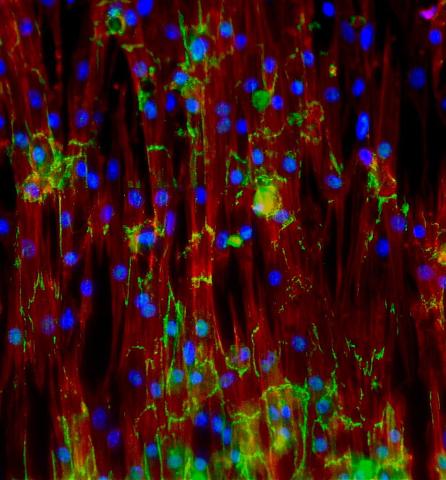
This image shows neonatal mouse heart cells. These cells were grown in the lab on a chip that aligns the cells in a way that mimics what is normally seen in the body. Green shows the protein N-cadherin, which indicates normal connections between cells. Red indicates the muscle protein actin, and blue indicates the cell nuclei. The work shown here was part of a study attempting to grow heart tissue in the lab to repair damage after a heart attack. Image and caption information courtesy of the California Institute for Regenerative Medicine. Related to images 3281 and 3283.
Kara McCloskey lab, University of California, Merced, via CIRM
View Media
6587: Cell-like compartments emerging from scrambled frog eggs
6587: Cell-like compartments emerging from scrambled frog eggs
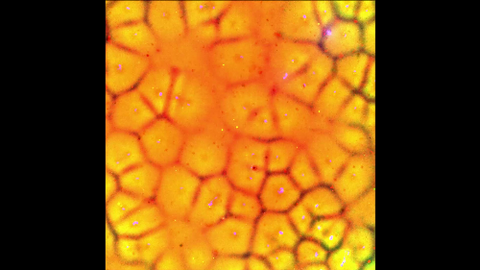
Cell-like compartments spontaneously emerge from scrambled frog eggs, with nuclei (blue) from frog sperm. Endoplasmic reticulum (red) and microtubules (green) are also visible. Video created using epifluorescence microscopy.
For more photos of cell-like compartments from frog eggs view: 6584, 6585, 6586, 6591, 6592, and 6593.
For videos of cell-like compartments from frog eggs view: 6588, 6589, and 6590.
Xianrui Cheng, Stanford University School of Medicine.
View Media
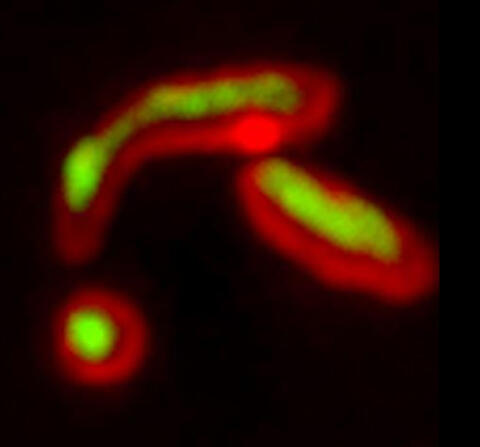
5878: Misfolded proteins within in the mitochondria
5878: Misfolded proteins within in the mitochondria
Misfolded proteins (green) within mitochondria (red). Related to video 5877.
Rong Li rong@jhu.edu Department of Chemical and Biomolecular Engineering, Whiting School of Engineering, Johns Hopkins University, Baltimore, Maryland 21218, USA.
View Media
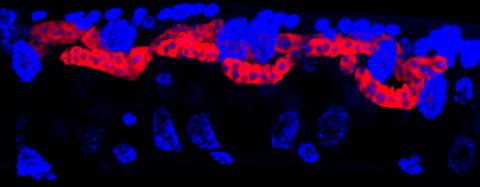
5779: Microsporidia in roundworm 3
5779: Microsporidia in roundworm 3
Many disease-causing microbes manipulate their host’s metabolism and cells for their own ends. Microsporidia—which are parasites closely related to fungi—infect and multiply inside animal cells, and take the rearranging of cells’ interiors to a new level. They reprogram animal cells such that the cells start to fuse, causing them to form long, continuous tubes. As shown in this image of the roundworm Caenorhabditis elegans, microsporidia (shown in red) have invaded the worm’s gut cells (the large blue dots are the cells' nuclei) and have instructed the cells to merge. The cell fusion enables the microsporidia to thrive and propagate in the expanded space. Scientists study microsporidia in worms to gain more insight into how these parasites manipulate their host cells. This knowledge might help researchers devise strategies to prevent or treat infections with microsporidia.
For more on the research into microsporidia, see this news release from the University of California San Diego. Related to images 5777 and 5778.
For more on the research into microsporidia, see this news release from the University of California San Diego. Related to images 5777 and 5778.
Keir Balla and Emily Troemel, University of California San Diego
View Media
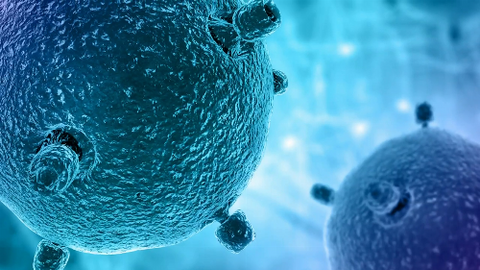
6597: Pathways – Bacteria vs. Viruses: What's the Difference?
6597: Pathways – Bacteria vs. Viruses: What's the Difference?
Learn about how bacteria and viruses differ, how they each can make you sick, and how they can or cannot be treated. Discover more resources from NIGMS’ Pathways collaboration with Scholastic. View the video on YouTube for closed captioning.
National Institute of General Medical Sciences
View Media
6550: Time-lapse video of floral pattern in a mixture of two bacterial species, Acinetobacter baylyi and Escherichia coli, grown on a semi-solid agar for 24 hours
6550: Time-lapse video of floral pattern in a mixture of two bacterial species, Acinetobacter baylyi and Escherichia coli, grown on a semi-solid agar for 24 hours
This time-lapse video shows the emergence of a flower-like pattern in a mixture of two bacterial species, motile Acinetobacter baylyi and non-motile Escherichia coli (green), that are grown together for 24 hours on 0.75% agar surface from a small inoculum in the center of a Petri dish.
See 6557 for a photo of this process at 24 hours on 0.75% agar surface.
See 6553 for a photo of this process at 48 hours on 1% agar surface.
See 6555 for another photo of this process at 48 hours on 1% agar surface.
See 6556 for a photo of this process at 72 hours on 0.5% agar surface.
See 6557 for a photo of this process at 24 hours on 0.75% agar surface.
See 6553 for a photo of this process at 48 hours on 1% agar surface.
See 6555 for another photo of this process at 48 hours on 1% agar surface.
See 6556 for a photo of this process at 72 hours on 0.5% agar surface.
L. Xiong et al, eLife 2020;9: e48885
View Media
6355: H1N1 Influenza Virus
6355: H1N1 Influenza Virus
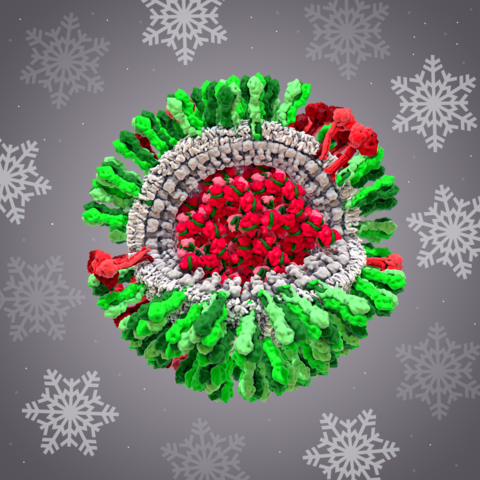
CellPack image of the H1N1 influenza virus, with hemagglutinin and neuraminidase glycoproteins in green and red, respectively, on the outer envelope (white); matrix protein in gray, and ribonucleoprotein particles inside the virus in red and green. Related to image 6356.
Dr. Rommie Amaro, University of California, San Diego
View Media

3772: The Proteasome: The Cell's Trash Processor in Action
3772: The Proteasome: The Cell's Trash Processor in Action
Our cells are constantly removing and recycling molecular waste. This video shows one way cells process their trash.
View Media
6985: Fruit fly brain responds to adipokines
6985: Fruit fly brain responds to adipokines
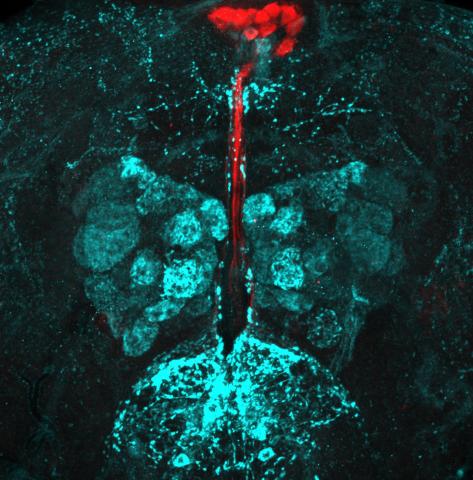
Drosophila adult brain showing that an adipokine (fat hormone) generates a response from neurons (aqua) and regulates insulin-producing neurons (red).
Related to images 6982, 6983, and 6984.
Related to images 6982, 6983, and 6984.
Akhila Rajan, Fred Hutchinson Cancer Center
View Media
6805: Staphylococcus aureus aggregating upon contact with synovial fluid
6805: Staphylococcus aureus aggregating upon contact with synovial fluid
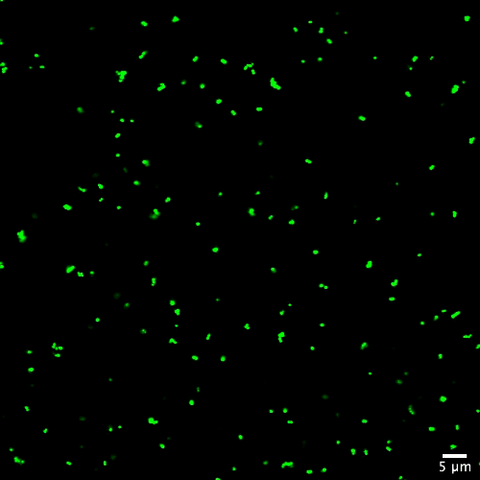
Staphylococcus aureus bacteria (green) grouping together upon contact with synovial fluid—a viscous substance found in joints. The formation of groups can help protect the bacteria from immune system defenses and from antibiotics, increasing the likelihood of an infection. This video is a 1-hour time lapse and was captured using a confocal laser scanning microscope.
More information about the research that produced this video can be found in the Journal of Bacteriology paper "In Vitro Staphylococcal Aggregate Morphology and Protection from Antibiotics Are Dependent on Distinct Mechanisms Arising from Postsurgical Joint Components and Fluid Motion" by Staats et al.
Related to images 6803 and 6804.
More information about the research that produced this video can be found in the Journal of Bacteriology paper "In Vitro Staphylococcal Aggregate Morphology and Protection from Antibiotics Are Dependent on Distinct Mechanisms Arising from Postsurgical Joint Components and Fluid Motion" by Staats et al.
Related to images 6803 and 6804.
Paul Stoodley, The Ohio State University.
View Media
1014: Lily mitosis 04
1014: Lily mitosis 04
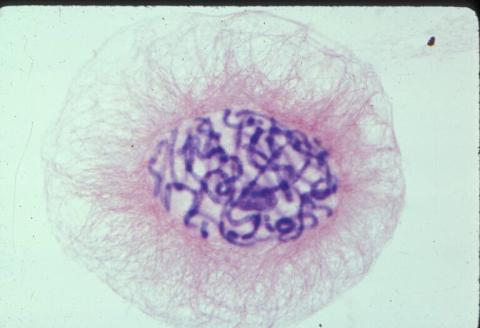
A light microscope image of a cell from the endosperm of an African globe lily (Scadoxus katherinae). This is one frame of a time-lapse sequence that shows cell division in action. The lily is considered a good organism for studying cell division because its chromosomes are much thicker and easier to see than human ones. Staining shows microtubules in red and chromosomes in blue.
Related to images 1010, 1011, 1012, 1013, 1015, 1016, 1017, 1018, 1019, and 1021.
Related to images 1010, 1011, 1012, 1013, 1015, 1016, 1017, 1018, 1019, and 1021.
Andrew S. Bajer, University of Oregon, Eugene
View Media
2434: Fruit fly retina 02
2434: Fruit fly retina 02
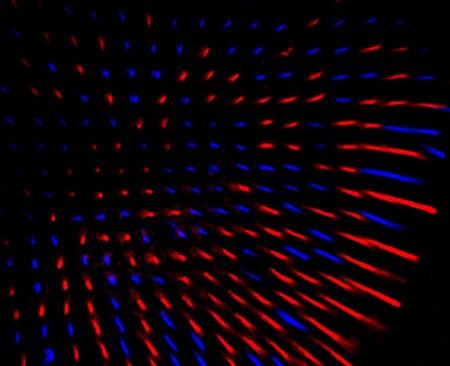
Section of a fruit fly retina showing the light-sensing molecules rhodopsin-5 (blue) and rhodopsin-6 (red).
Hermann Steller, Rockefeller University
View Media
3688: Brain cells in the hippocampus
3688: Brain cells in the hippocampus
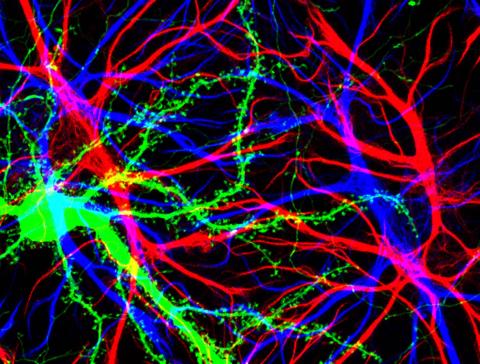
Hippocampal cells in culture with a neuron in green, showing hundreds of the small protrusions known as dendritic spines. The dendrites of other neurons are labeled in blue, and adjacent glial cells are shown in red.
Shelley Halpain, UC San Diego
View Media
2333: Worms and human infertility
2333: Worms and human infertility
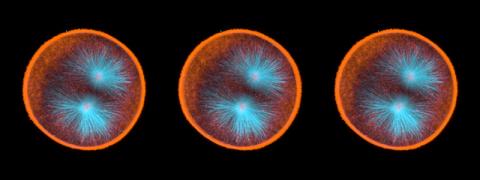
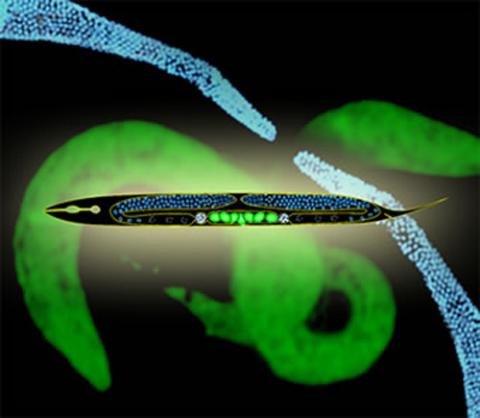
This montage of tiny, transparent C. elegans--or roundworms--may offer insight into understanding human infertility. Researchers used fluorescent dyes to label the worm cells and watch the process of sex cell division, called meiosis, unfold as nuclei (blue) move through the tube-like gonads. Such visualization helps the scientists identify mechanisms that enable these roundworms to reproduce successfully. Because meiosis is similar in all sexually reproducing organisms, what the scientists learn could apply to humans.
Abby Dernburg, Lawrence Berkeley National Laboratory
View Media
2439: Hydra 03
2439: Hydra 03
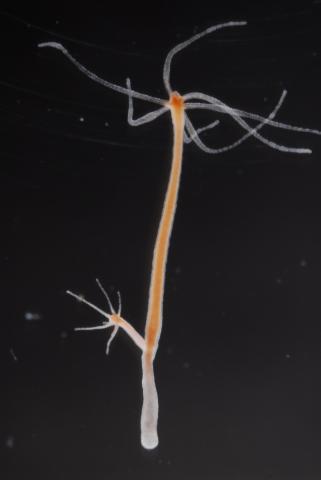
Hydra magnipapillata is an invertebrate animal used as a model organism to study developmental questions, for example the formation of the body axis.
Hiroshi Shimizu, National Institute of Genetics in Mishima, Japan
View Media
3791: Nucleolus subcompartments spontaneously self-assemble 2
3791: Nucleolus subcompartments spontaneously self-assemble 2
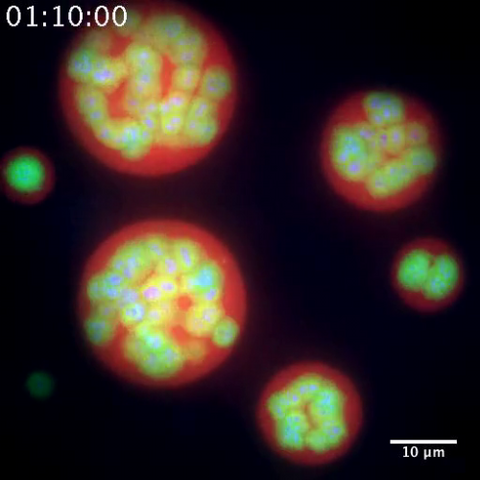
The nucleolus is a small but very important protein complex located in the cell's nucleus. It forms on the chromosomes at the location where the genes for the RNAs are that make up the structure of the ribosome, the indispensable cellular machine that makes proteins from messenger RNAs.
However, how the nucleolus grows and maintains its structure has puzzled scientists for some time. It turns out that even though it looks like a simple liquid blob, it's rather well-organized, consisting of three distinct layers: the fibrillar center, where the RNA polymerase is active; the dense fibrillar component, which is enriched in the protein fibrillarin; and the granular component, which contains a protein called nucleophosmin. Researchers have now discovered that this multilayer structure of the nucleolus arises from differences in how the proteins in each compartment mix with water and with each other. These differences let the proteins readily separate from each other into the three nucleolus compartments.
This video of nucleoli in the eggs of a commonly used lab animal, the frog Xenopus laevis, shows how each of the compartments (the granular component is shown in red, the fibrillarin in yellow-green, and the fibrillar center in blue) spontaneously fuse with each other on encounter without mixing with the other compartments.
For more details on this research, see this press release from Princeton. Related to video 3789, image 3792 and image 3793.
However, how the nucleolus grows and maintains its structure has puzzled scientists for some time. It turns out that even though it looks like a simple liquid blob, it's rather well-organized, consisting of three distinct layers: the fibrillar center, where the RNA polymerase is active; the dense fibrillar component, which is enriched in the protein fibrillarin; and the granular component, which contains a protein called nucleophosmin. Researchers have now discovered that this multilayer structure of the nucleolus arises from differences in how the proteins in each compartment mix with water and with each other. These differences let the proteins readily separate from each other into the three nucleolus compartments.
This video of nucleoli in the eggs of a commonly used lab animal, the frog Xenopus laevis, shows how each of the compartments (the granular component is shown in red, the fibrillarin in yellow-green, and the fibrillar center in blue) spontaneously fuse with each other on encounter without mixing with the other compartments.
For more details on this research, see this press release from Princeton. Related to video 3789, image 3792 and image 3793.
Nilesh Vaidya, Princeton University
View Media
5765: Mitotic cell awaits chromosome alignment
5765: Mitotic cell awaits chromosome alignment
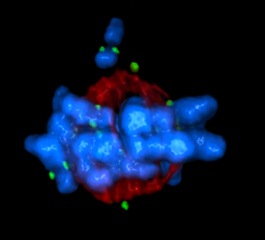
During mitosis, spindle microtubules (red) attach to chromosome pairs (blue), directing them to the spindle equator. This midline alignment is critical for equal distribution of chromosomes in the dividing cell. Scientists are interested in how the protein kinase Plk1 (green) regulates this activity in human cells. Image is a volume projection of multiple deconvolved z-planes acquired with a Nikon widefield fluorescence microscope. This image was chosen as a winner of the 2016 NIH-funded research image call. Related to image 5766.
The research that led to this image was funded by NIGMS.
View Media
The research that led to this image was funded by NIGMS.
3449: Calcium uptake during ATP production in mitochondria
3449: Calcium uptake during ATP production in mitochondria
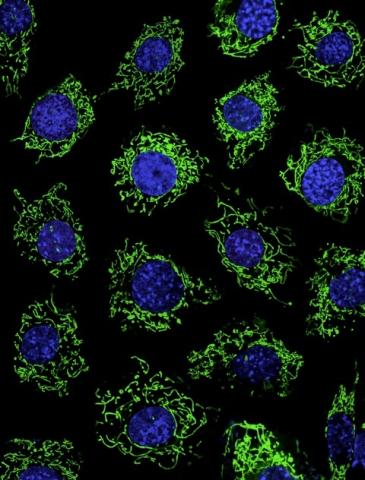
Living primary mouse embryonic fibroblasts. Mitochondria (green) stained with the mitochondrial membrane potential indicator, rhodamine 123. Nuclei (blue) are stained with DAPI. Caption from a November 26, 2012 news release from U Penn (Penn Medicine).
Lili Guo, Perelman School of Medicine, University of Pennsylvania
View Media
3446: Biofilm blocking fluid flow
3446: Biofilm blocking fluid flow
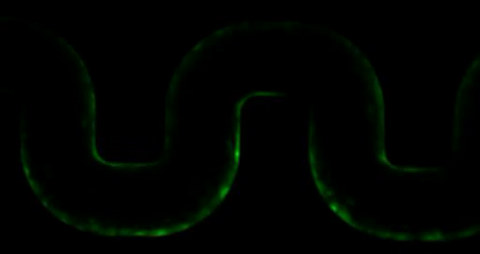
This time-lapse movie shows that bacterial communities called biofilms can create blockages that prevent fluid flow in devices such as stents and catheters over a period of about 56 hours. This video was featured in a news release from Princeton University.
Bonnie Bassler, Princeton University
View Media
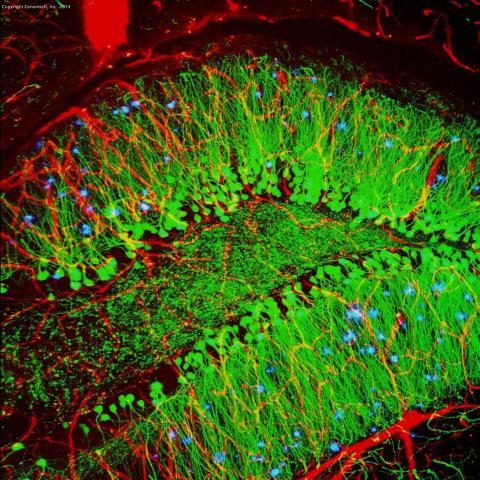
3604: Brain showing hallmarks of Alzheimer's disease
3604: Brain showing hallmarks of Alzheimer's disease
Along with blood vessels (red) and nerve cells (green), this mouse brain shows abnormal protein clumps known as plaques (blue). These plaques multiply in the brains of people with Alzheimer's disease and are associated with the memory impairment characteristic of the disease. Because mice have genomes nearly identical to our own, they are used to study both the genetic and environmental factors that trigger Alzheimer's disease. Experimental treatments are also tested in mice to identify the best potential therapies for human patients.
This image was part of the Life: Magnified exhibit that ran from June 3, 2014, to January 21, 2015, at Dulles International Airport.
This image was part of the Life: Magnified exhibit that ran from June 3, 2014, to January 21, 2015, at Dulles International Airport.
Alvin Gogineni, Genentech
View Media
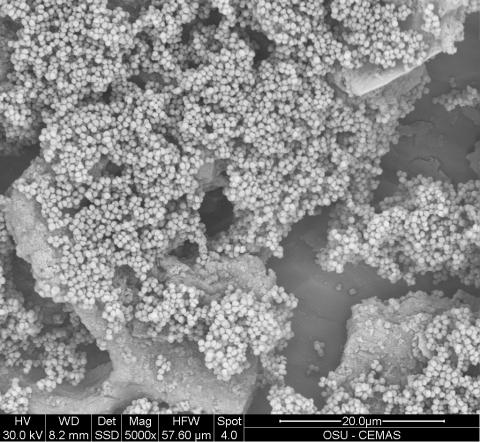
6803: Staphylococcus aureus aggregates on microstructured titanium surface
6803: Staphylococcus aureus aggregates on microstructured titanium surface
Groups of Staphylococcus aureus bacteria (blue) attached to a microstructured titanium surface (green) that mimics an orthopedic implant used in joint replacement. The attachment of pre-formed groups of bacteria may lead to infections because the groups can tolerate antibiotics and evade the immune system. This image was captured using a scanning electron microscope.
More information on the research that produced this image can be found in the Antibiotics paper "Free-floating aggregate and single-cell-initiated biofilms of Staphylococcus aureus" by Gupta et al.
Related to image 6804 and video 6805.
More information on the research that produced this image can be found in the Antibiotics paper "Free-floating aggregate and single-cell-initiated biofilms of Staphylococcus aureus" by Gupta et al.
Related to image 6804 and video 6805.
Paul Stoodley, The Ohio State University.
View Media
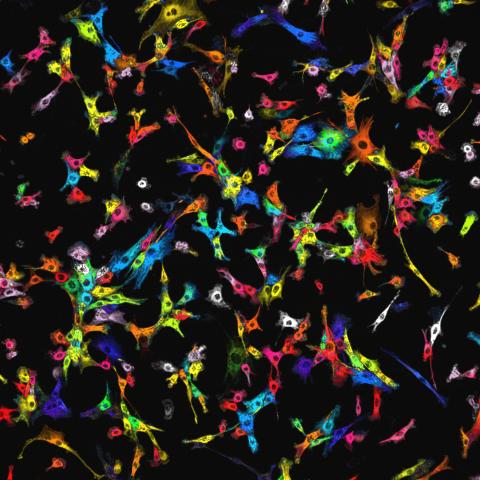
7021: Single-cell “radios” image
7021: Single-cell “radios” image
Individual cells are color-coded based on their identity and signaling activity using a protein circuit technology developed by the Coyle Lab. Just as a radio allows you to listen to an individual frequency, this technology allows researchers to tune into the specific “radio station” of each cell through genetically encoded proteins from a bacterial system called MinDE. The proteins generate an oscillating fluorescent signal that transmits information about cell shape, state, and identity that can be decoded using digital signal processing tools originally designed for telecommunications. The approach allows researchers to look at the dynamics of a single cell in the presence of many other cells.
Related to video 7022.
Related to video 7022.
Scott Coyle, University of Wisconsin-Madison.
View Media
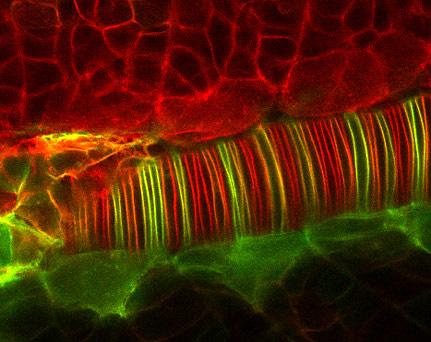
2328: Neural tube development
2328: Neural tube development
Proteins in the neural tissues of this zebrafish embryo direct cells to line up and form the neural tube, which will become the spinal cord and brain. Studies of zebrafish embryonic development may help pinpoint the underlying cause of common neural tube defects--such as spina bifida--which occur in about 1 in 1,000 newborn children.
Alexander Schier, Harvard University
View Media
2603: Induced stem cells from adult skin 01
2603: Induced stem cells from adult skin 01
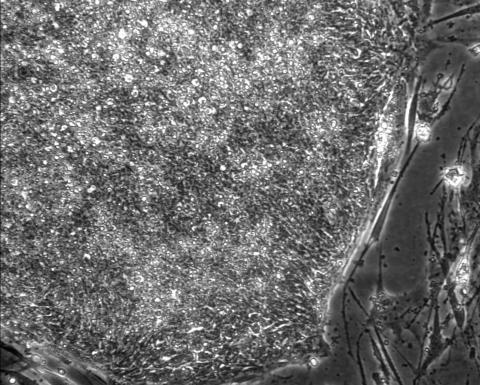
These cells are induced stem cells made from human adult skin cells that were genetically reprogrammed to mimic embryonic stem cells. The induced stem cells were made potentially safer by removing the introduced genes and the viral vector used to ferry genes into the cells, a loop of DNA called a plasmid. The work was accomplished by geneticist Junying Yu in the laboratory of James Thomson, a University of Wisconsin-Madison School of Medicine and Public Health professor and the director of regenerative biology for the Morgridge Institute for Research.
James Thomson, University of Wisconsin-Madison
View Media

2714: Stretch detectors
2714: Stretch detectors
Muscles stretch and contract when we walk, and skin splits open and knits back together when we get a paper cut. To study these contractile forces, researchers built a three-dimensional scaffold that mimics tissue in an organism. Researchers poured a mixture of cells and elastic collagen over microscopic posts in a dish. Then they studied how the cells pulled and released the posts as they formed a web of tissue. To measure forces between posts, the researchers developed a computer model. Their findings--which show that contractile forces vary throughout the tissue--could have a wide range of medical applications.
Christopher Chen, University of Pennsylvania
View Media
3276: Human ES cells differentiating into neurons
3276: Human ES cells differentiating into neurons
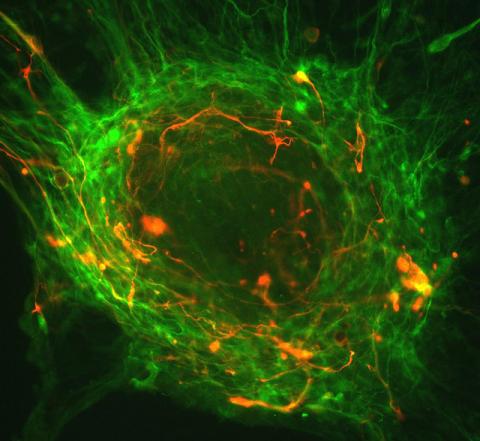
This image shows hundreds of human embryonic stem cells in various stages of differentiating into neurons. Some cells have become neurons (red), while others are still precursors of nerve cells (green). The yellow is an imaging artifact resulting when cells in both stages are on top of each other. Image and caption information courtesy of the California Institute for Regenerative Medicine.
Guoping Fan lab, University of California, Los Angeles, via CIRM
View Media
1311: Housekeeping cell illustration
3518: HeLa cells
3518: HeLa cells
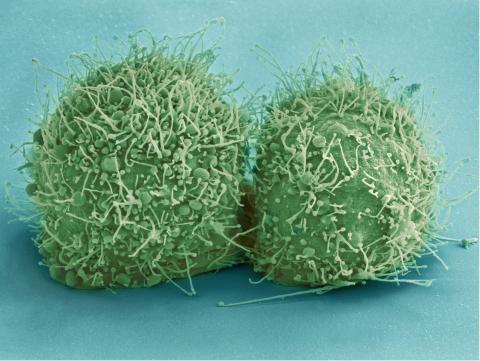
Scanning electron micrograph of just-divided HeLa cells. Zeiss Merlin HR-SEM. See related images 3519, 3520, 3521, 3522.
National Center for Microscopy and Imaging Research
View Media
5772: Confocal microscopy image of two Drosophila ovarioles
5772: Confocal microscopy image of two Drosophila ovarioles
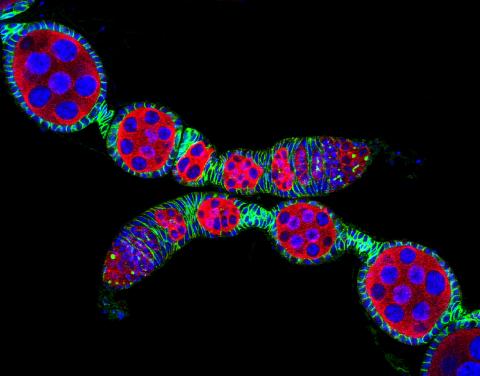
Ovarioles in female insects are tubes in which egg cells (called oocytes) form at one end and complete their development as they reach the other end of the tube. This image, taken with a confocal microscope, shows ovarioles in a very popular lab animal, the fruit fly Drosophila. The basic structure of ovarioles supports very rapid egg production, with some insects (like termites) producing several thousand eggs per day. Each insect ovary typically contains four to eight ovarioles, but this number varies widely depending on the insect species.
Scientists use insect ovarioles, for example, to study the basic processes that help various insects, including those that cause disease (like some mosquitos and biting flies), reproduce very quickly.
Scientists use insect ovarioles, for example, to study the basic processes that help various insects, including those that cause disease (like some mosquitos and biting flies), reproduce very quickly.
2004 Olympus BioScapes Competition
View Media
7023: Dynein moving along microtubules
7023: Dynein moving along microtubules
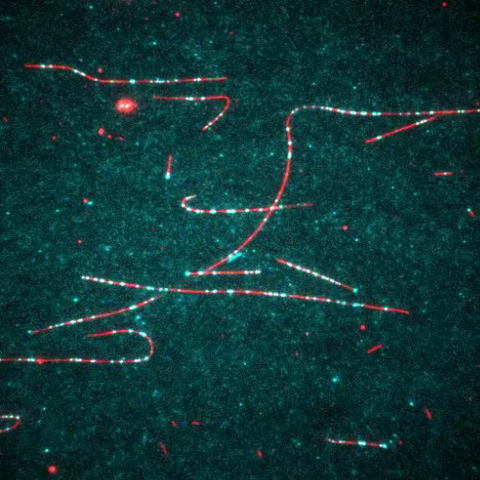
Dynein (green) is a motor protein that “walks” along microtubules (red, part of the cytoskeleton) and carries its cargo along with it. This video was captured through fluorescence microscopy.
Morgan DeSantis, University of Michigan.
View Media
3599: Skin cell (keratinocyte)
3599: Skin cell (keratinocyte)
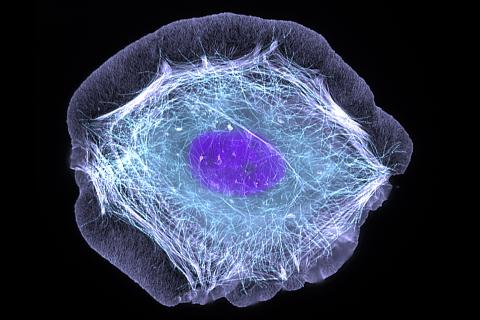
This normal human skin cell was treated with a growth factor that triggered the formation of specialized protein structures that enable the cell to move. We depend on cell movement for such basic functions as wound healing and launching an immune response.
This image was part of the Life: Magnified exhibit that ran from June 3, 2014, to January 21, 2015, at Dulles International Airport.
This image was part of the Life: Magnified exhibit that ran from June 3, 2014, to January 21, 2015, at Dulles International Airport.
Torsten Wittmann, University of California, San Francisco
View Media
3497: Wound healing in process
3497: Wound healing in process
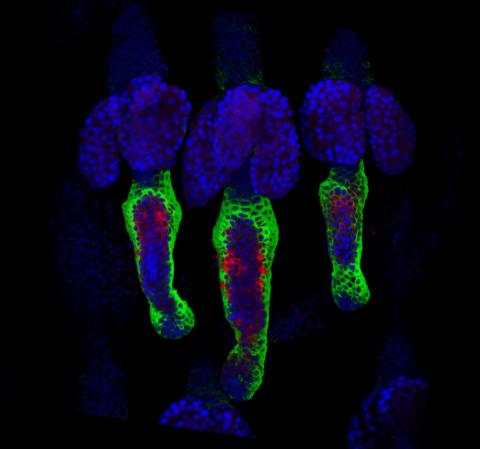
Wound healing requires the action of stem cells. In mice that lack the Sept2/ARTS gene, stem cells involved in wound healing live longer and wounds heal faster and more thoroughly than in normal mice. This confocal microscopy image from a mouse lacking the Sept2/ARTS gene shows a tail wound in the process of healing. See more information in the article in Science.
Related to images 3498 and 3500.
Related to images 3498 and 3500.
Hermann Steller, Rockefeller University
View Media
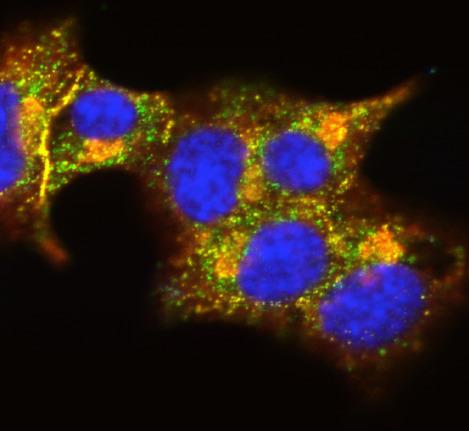
3546: Insulin and protein interact in pancreatic beta cells
3546: Insulin and protein interact in pancreatic beta cells
A large number of proteins interact with the hormone insulin as it is produced in and secreted from the beta cells of the pancreas. In this image, the interactions of TMEM24 protein (green) and insulin (red) in pancreatic beta cells are shown in yellow. More information about the research behind this image can be found in a Biomedical Beat Blog posting from November 2013.
William E. Balch, The Scripps Research Institute
View Media
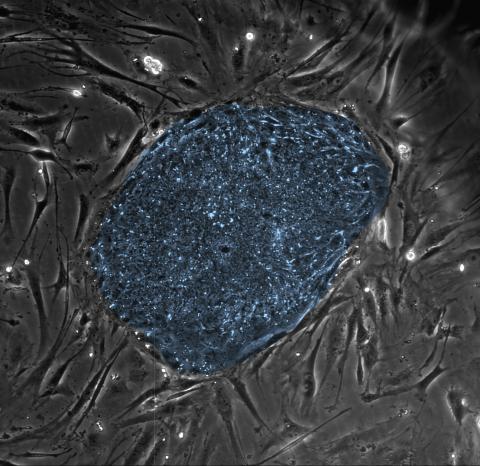
2608: Human embryonic stem cells
2608: Human embryonic stem cells
The center cluster of cells, colored blue, shows a colony of human embryonic stem cells. These cells, which arise at the earliest stages of development, are capable of differentiating into any of the 220 types of cells in the human body and can provide access to cells for basic research and potential therapies. This image is from the lab of the University of Wisconsin-Madison's James Thomson.
James Thomson, University of Wisconsin-Madison
View Media
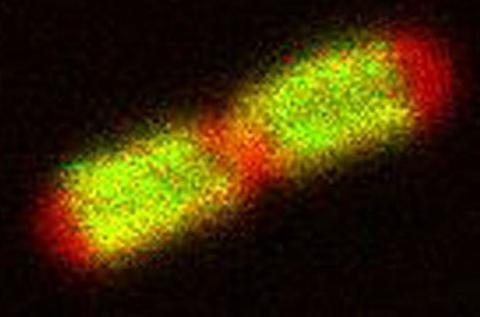
3549: TonB protein in gram-negative bacteria
3549: TonB protein in gram-negative bacteria
The green in this image highlights a protein called TonB, which is produced by many gram-negative bacteria, including those that cause typhoid fever, meningitis and dysentery. TonB lets bacteria take up iron from the host's body, which they need to survive. More information about the research behind this image can be found in a Biomedical Beat Blog posting from August 2013.
Phillip Klebba, Kansas State University
View Media
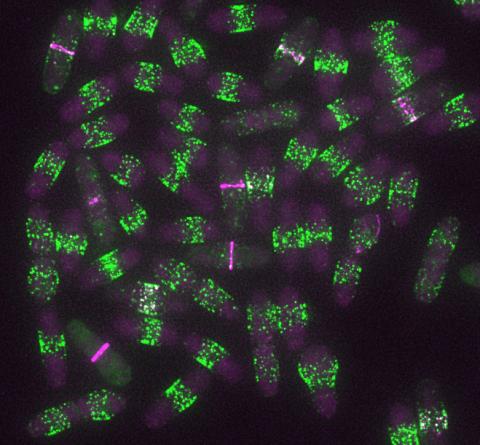
6791: Yeast cells entering mitosis
6791: Yeast cells entering mitosis
Yeast cells entering mitosis, also known as cell division. The green and magenta dots are two proteins that play important roles in mitosis. They show where the cells will split. This image was captured using wide-field microscopy with deconvolution.
Related to images 6792, 6793, 6794, 6797, 6798, and videos 6795 and 6796.
Related to images 6792, 6793, 6794, 6797, 6798, and videos 6795 and 6796.
Alaina Willet, Kathy Gould’s lab, Vanderbilt University.
View Media
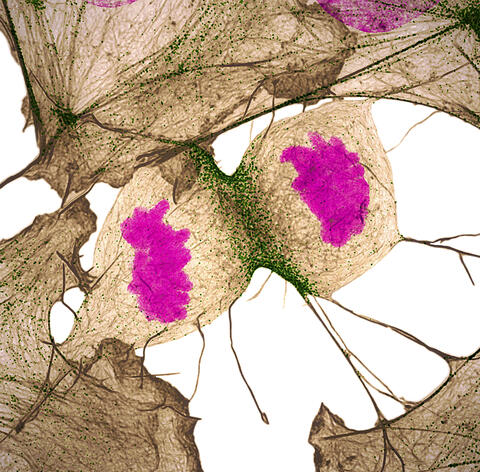
6519: Human fibroblast undergoing cell division
6519: Human fibroblast undergoing cell division
During cell division, cells physically divide after separating their genetic material to create two daughter cells that are genetically identical to the parent cell. This process is important so that new cells can grow and develop. In this image, a human fibroblast cell—a type of connective tissue cell that plays a key role in wound healing and tissue repair—is dividing into two daughter cells. A cell protein called actin appears gray, the myosin II (part of the family of motor proteins responsible for muscle contractions) appears green, and DNA appears magenta.
Nilay Taneja, Vanderbilt University, and Dylan T. Burnette, Ph.D., Vanderbilt University School of Medicine.
View Media
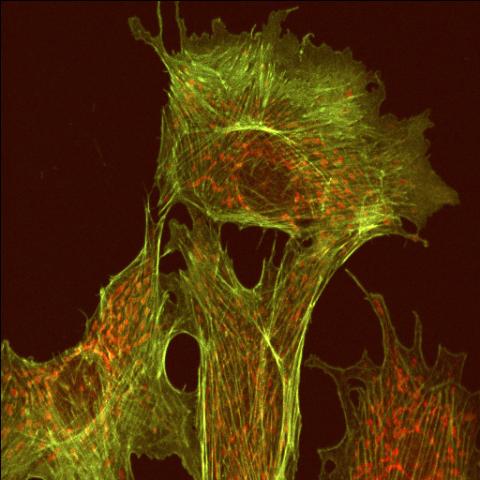
1102: Endothelial cell
1102: Endothelial cell
This image shows two components of the cytoskeleton, microtubules (green) and actin filaments (red), in an endothelial cell derived from a cow lung. The cystoskeleton provides the cell with an inner framework and enables it to move and change shape.
Tina Weatherby Carvalho, University of Hawaii at Manoa
View Media
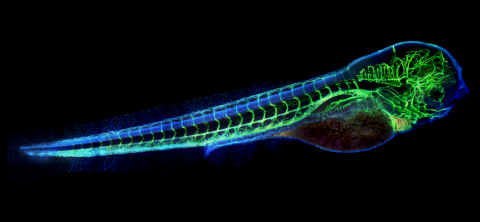
6661: Zebrafish embryo showing vasculature
6661: Zebrafish embryo showing vasculature
A zebrafish embryo. The blue areas are cell bodies, the green lines are blood vessels, and the red glow is blood. This image was created by stitching together five individual images captured with a hyperspectral multipoint confocal fluorescence microscope that was developed at the Eliceiri Lab.
Kevin Eliceiri, University of Wisconsin-Madison.
View Media
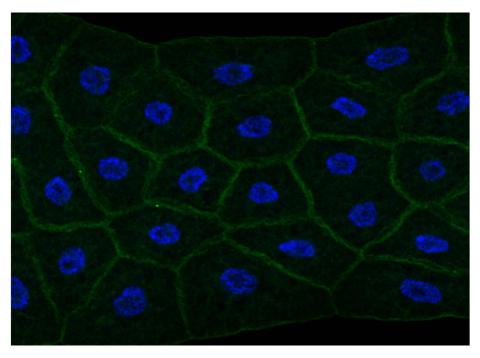
2757: Draper, shown in the fatbody of a Drosophila melanogaster larva
2757: Draper, shown in the fatbody of a Drosophila melanogaster larva
The fly fatbody is a nutrient storage and mobilization organ akin to the mammalian liver. The engulfment receptor Draper (green) is located at the cell surface of fatbody cells. The cell nuclei are shown in blue.
Christina McPhee and Eric Baehrecke, University of Massachusetts Medical School
View Media