
Switch to List View
Image and Video Gallery
This is a searchable collection of scientific photos, illustrations, and videos. The images and videos in this gallery are licensed under Creative Commons Attribution Non-Commercial ShareAlike 3.0. This license lets you remix, tweak, and build upon this work non-commercially, as long as you credit and license your new creations under identical terms.
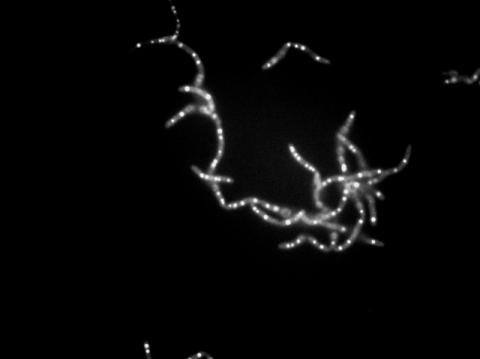
3481: Bacillus anthracis being killed
3481: Bacillus anthracis being killed
Bacillus anthracis (anthrax) cells being killed by a fluorescent trans-translation inhibitor, which disrupts bacterial protein synthesis. The inhibitor is naturally fluorescent and looks blue when it is excited by ultraviolet light in the microscope. This is a black-and-white version of Image 3525.
John Alumasa, Keiler Laboratory, Pennsylvania State University
View Media
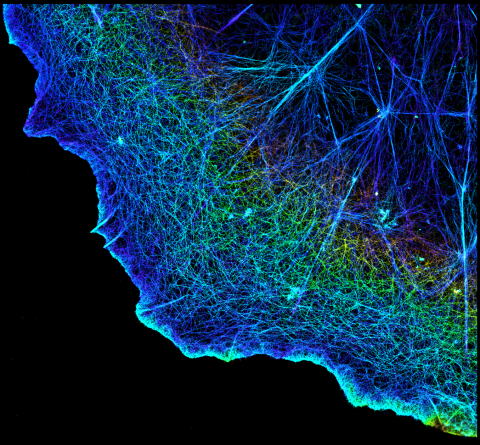
3749: 3D image of actin in a cell
3749: 3D image of actin in a cell
Actin is an essential protein in a cell's skeleton (cytoskeleton). It forms a dense network of thin filaments in the cell. Here, researchers have used a technique called stochastic optical reconstruction microscopy (STORM) to visualize the actin network in a cell in three dimensions. The actin strands were labeled with a dye called Alexa Fluor 647-phalloidin. This image appears in a study published by Nature Methods, which reports how researchers use STORM to visualize the cytoskeleton.
Xiaowei Zhuang, Howard Hughes Medical Institute, Harvard University
View Media
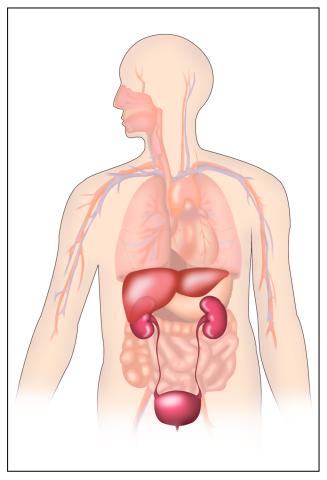
2496: Body toxins
2496: Body toxins
Body organs such as the liver and kidneys process chemicals and toxins. These "target" organs are susceptible to damage caused by these substances. See image 2497 for a labeled version of this illustration.
Crabtree + Company
View Media
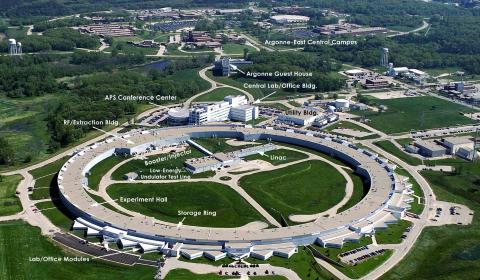
2358: Advanced Photon Source (APS) at Argonne National Lab
2358: Advanced Photon Source (APS) at Argonne National Lab
The intense X-rays produced by synchrotrons such as the Advanced Photon Source are ideally suited for protein structure determination. Using synchrotron X-rays and advanced computers scientists can determine protein structures at a pace unheard of decades ago.
Southeast Collaboratory for Structural Genomics
View Media
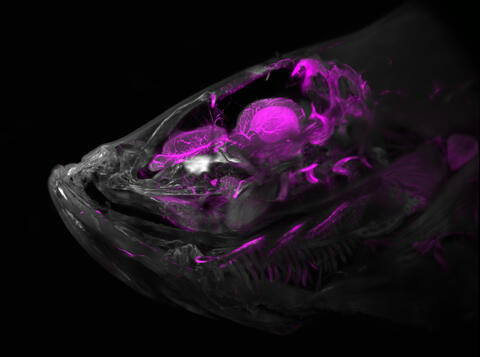
6934: Zebrafish head vasculature
6934: Zebrafish head vasculature
A zebrafish head with blood vessels shown in purple. Researchers often study zebrafish because they share many genes with humans, grow and reproduce quickly, and have see-through eggs and embryos, which make it easy to study early stages of development.
This image was captured using a light sheet microscope.
Related to video 6933.
This image was captured using a light sheet microscope.
Related to video 6933.
Prayag Murawala, MDI Biological Laboratory and Hannover Medical School.
View Media
3448: Dynamin Fission
3448: Dynamin Fission
Time lapse series shows short dynamin assemblies (not visible) constricting a lipid tube to make a "beads on a string" appearance, then cutting off one of the beads i.e., catalyzing membrane fission). The lipids are fluorescent (artificially colored). Ramachandran R, Pucadyil T.J., Liu Y.W., Acharya S., Leonard M., Lukiyanchuk V., Schmid S.L. 2009. Membrane insertion of the pleckstrin homology domain variable loop 1 is critical for dynamin-catalyzed vesicle scission. Mol Biol Cell. 2009 20:4630-9.
Ramachandran, Pucadyil et al. , The Scripps Research Institute
View Media
3566: Mouse colon with gut bacteria
3566: Mouse colon with gut bacteria
A section of mouse colon with gut bacteria (center, in green) residing within a protective pocket. Understanding how microorganisms colonize the gut could help devise ways to correct for abnormal changes in bacterial communities that are associated with disorders like inflammatory bowel disease.
Sarkis K. Mazmanian, California Institute of Technology
View Media
3598: Developing zebrafish fin
3598: Developing zebrafish fin
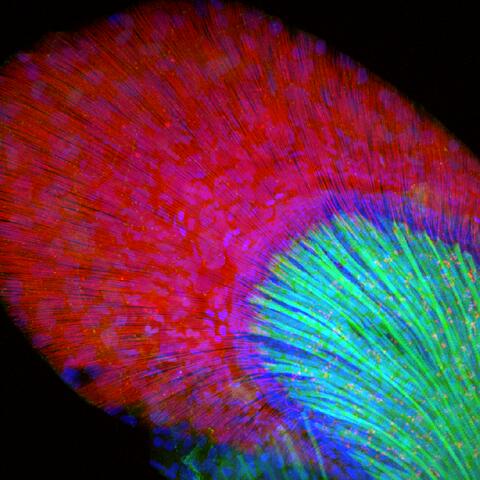
Originally from the waters of India, Nepal, and neighboring countries, zebrafish can now be found swimming in science labs (and home aquariums) throughout the world. This fish is a favorite study subject for scientists interested in how genes guide the early stages of prenatal development (including the developing fin shown here) and in the effects of environmental contamination on embryos.
In this image, green fluorescent protein (GFP) is expressed where the gene sox9b is expressed. Collagen (red) marks the fin rays, and DNA, stained with a dye called DAPI, is in blue. sox9b plays many important roles during development, including the building of the heart and brain, and is also necessary for skeletal development. At the University of Wisconsin, researchers have found that exposure to contaminants that bind the aryl-hydrocarbon receptor results in the downregulation of sox9b. Loss of sox9b severely disrupts development in zebrafish and causes a life-threatening disorder called campomelic dysplasia (CD) in humans. CD is characterized by cardiovascular, neural, and skeletal defects. By studying the roles of genes such as sox9b in zebrafish, scientists hope to better understand normal development in humans as well as how to treat developmental disorders and diseases.
This image was part of the Life: Magnified exhibit that ran from June 3, 2014, to January 21, 2015, at Dulles International Airport.
Jessica Plavicki
View Media
6967: Multinucleated cancer cell
6967: Multinucleated cancer cell
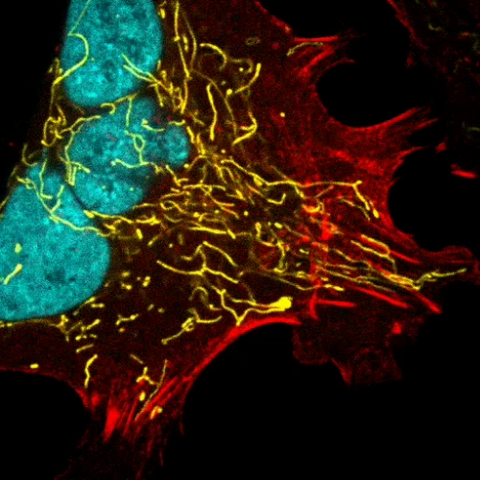
A cancer cell with three nuclei, shown in turquoise. The abnormal number of nuclei indicates that the cell failed to go through cell division, probably more than once. Mitochondria are shown in yellow, and a protein of the cell’s cytoskeleton appears in red. This video was captured using a confocal microscope.
Dylan T. Burnette, Vanderbilt University School of Medicine.
View Media
3272: Ear hair cells derived from embryonic stem cells
3272: Ear hair cells derived from embryonic stem cells
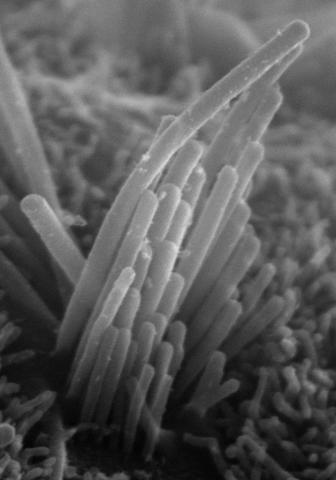
Mouse embryonic stem cells matured into this bundle of hair cells similar to the ones that transmit sound in the ear. These cells could one day be transplanted as a therapy for some forms of deafness, or they could be used to screen drugs to treat deafness. The hairs are shown at 23,000 times magnification via scanning electron microscopy. Image and caption information courtesy of the California Institute for Regenerative Medicine.
Stefen Heller, Stanford University, via CIRM
View Media
6351: CRISPR
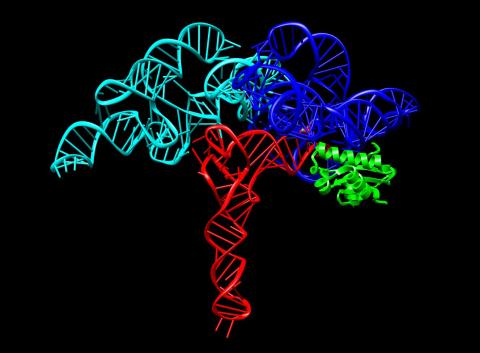
6351: CRISPR
RNA incorporated into the CRISPR surveillance complex is positioned to scan across foreign DNA. Cryo-EM density from a 3Å reconstruction is shown as a yellow mesh.
NRAMM National Resource for Automated Molecular Microscopy http://nramm.nysbc.org/nramm-images/ Source: Bridget Carragher
View Media

2714: Stretch detectors
2714: Stretch detectors
Muscles stretch and contract when we walk, and skin splits open and knits back together when we get a paper cut. To study these contractile forces, researchers built a three-dimensional scaffold that mimics tissue in an organism. Researchers poured a mixture of cells and elastic collagen over microscopic posts in a dish. Then they studied how the cells pulled and released the posts as they formed a web of tissue. To measure forces between posts, the researchers developed a computer model. Their findings--which show that contractile forces vary throughout the tissue--could have a wide range of medical applications.
Christopher Chen, University of Pennsylvania
View Media

3592: Math from the heart
3592: Math from the heart
Watch a cell ripple toward a beam of light that turns on a movement-related protein.
View Media
7000: Plastic-eating enzymes
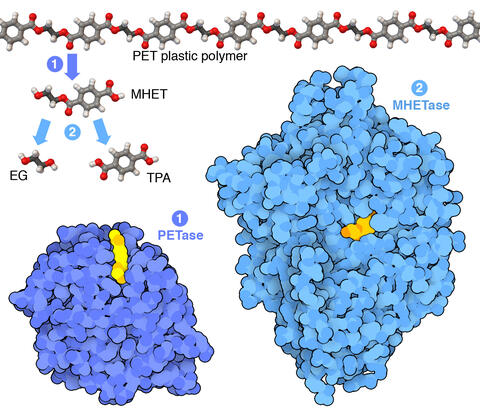
7000: Plastic-eating enzymes
PETase enzyme degrades polyester plastic (polyethylene terephthalate, or PET) into monohydroxyethyl terephthalate (MHET). Then, MHETase enzyme degrades MHET into its constituents ethylene glycol (EG) and terephthalic acid (TPA).
Find these in the RCSB Protein Data Bank: PET hydrolase (PDB entry 5XH3) and MHETase (PDB entry 6QGA).
Find these in the RCSB Protein Data Bank: PET hydrolase (PDB entry 5XH3) and MHETase (PDB entry 6QGA).
Amy Wu and Christine Zardecki, RCSB Protein Data Bank.
View Media
3609: Pollen grains: male germ cells in plants and a cause of seasonal allergies
3609: Pollen grains: male germ cells in plants and a cause of seasonal allergies
Those of us who get sneezy and itchy-eyed every spring or fall may have pollen grains, like those shown here, to blame. Pollen grains are the male germ cells of plants, released to fertilize the corresponding female plant parts. When they are instead inhaled into human nasal passages, they can trigger allergies.
This image was part of the Life: Magnified exhibit that ran from June 3, 2014, to January 21, 2015, at Dulles International Airport.
This image was part of the Life: Magnified exhibit that ran from June 3, 2014, to January 21, 2015, at Dulles International Airport.
Edna, Gil, and Amit Cukierman, Fox Chase Cancer Center, Philadelphia, Pa.
View Media
1244: Nerve ending
1244: Nerve ending
A scanning electron microscope picture of a nerve ending. It has been broken open to reveal vesicles (orange and blue) containing chemicals used to pass messages in the nervous system.
Tina Weatherby Carvalho, University of Hawaii at Manoa
View Media
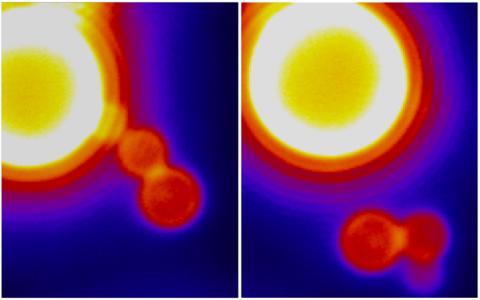
3728: Quorum-sensing inhibitor limits bacterial growth
3728: Quorum-sensing inhibitor limits bacterial growth
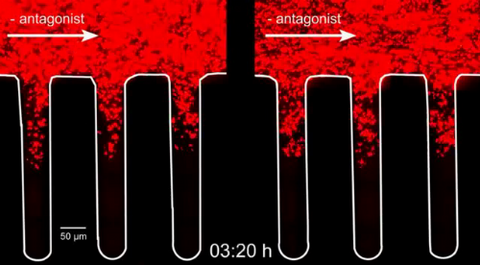
To simulate the consequences of disrupting bacterial cell-to-cell communication, called quorum sensing, in the crypts (small chambers within the colon), the researchers experimented with an inhibitor molecule (i.e., antagonist) to turn off quorum sensing in methicillin-resistant Staphylococcus aureus (MRSA), an antibiotic-resistant strain of bacteria that often causes human infections. In this experiment, a medium promoting bacterial growth flows through experimental chambers mimicking the colon environment. The chambers on the right contained no antagonist. In the left chambers, after being added to the flowing medium, the quorum-sensing-inhibiting molecules quickly spread throughout the crevices, inactivating quorum sensing and reducing colonization. These results suggest a potential strategy for addressing MRSA virulence via inhibitors of bacterial communication. You can read more about this research here.
Minyoung Kevin Kim and Bonnie Bassler, Princeton University
View Media
3251: Spinal nerve cells
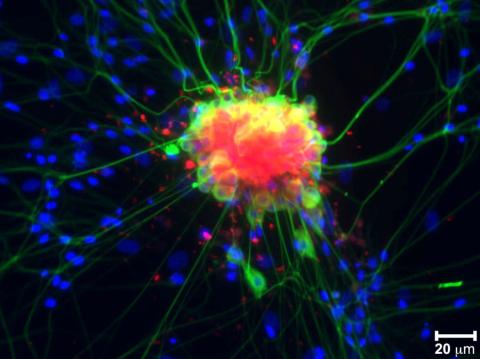
3251: Spinal nerve cells
Neurons (green) and glial cells from isolated dorsal root ganglia express COX-2 (red) after exposure to an inflammatory stimulus (cell nuclei are blue). Lawrence Marnett and colleagues have demonstrated that certain drugs selectively block COX-2 metabolism of endocannabinoids -- naturally occurring analgesic molecules -- in stimulated dorsal root ganglia. Featured in the October 20, 2011 issue of Biomedical Beat.
Lawrence Marnett, Vanderbilt University
View Media
3525: Bacillus anthracis being killed
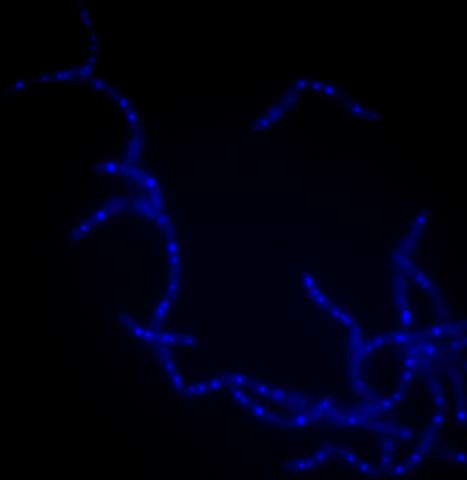
3525: Bacillus anthracis being killed
Bacillus anthracis (anthrax) cells being killed by a fluorescent trans-translation inhibitor, which disrupts bacterial protein synthesis. The inhibitor is naturally fluorescent and looks blue when it is excited by ultraviolet light in the microscope. This is a color version of Image 3481.
Kenneth Keiler, Penn State University
View Media

2702: Thermotoga maritima and its metabolic network
2702: Thermotoga maritima and its metabolic network
A combination of protein structures determined experimentally and computationally shows us the complete metabolic network of a heat-loving bacterium.
View Media
3419: X-ray co-crystal structure of Src kinase bound to a DNA-templated macrocycle inhibitor 7
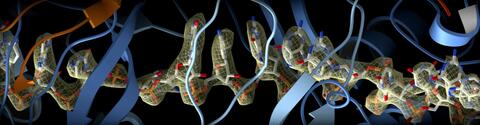
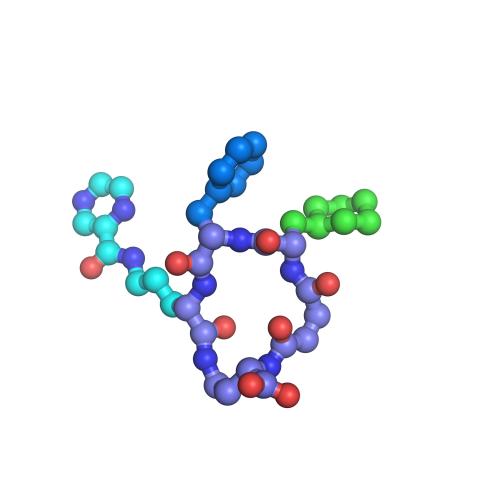
3419: X-ray co-crystal structure of Src kinase bound to a DNA-templated macrocycle inhibitor 7
X-ray co-crystal structure of Src kinase bound to a DNA-templated macrocycle inhibitor. Related to images 3413, 3414, 3415, 3416, 3417, and 3418.
Markus A. Seeliger, Stony Brook University Medical School and David R. Liu, Harvard University
View Media

3425: Red Poppy
3329: Spreading Cells- 02
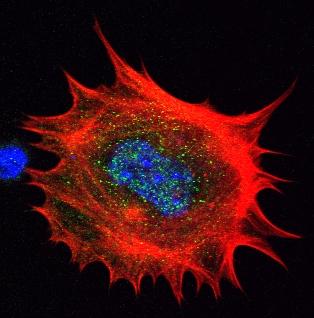
3329: Spreading Cells- 02
Cells move forward with lamellipodia and filopodia supported by networks and bundles of actin filaments. Proper, controlled cell movement is a complex process. Recent research has shown that an actin-polymerizing factor called the Arp2/3 complex is the key component of the actin polymerization engine that drives amoeboid cell motility. ARPC3, a component of the Arp2/3 complex, plays a critical role in actin nucleation. In this photo, the ARPC3-/- fibroblast cells were fixed and stained with Alexa 546 phalloidin for F-actin (red), Arp2 (green), and DAPI to visualize the nucleus (blue). Arp2, a subunit of the Arp2/3 complex, is absent in the filopodi-like structures based leading edge of ARPC3-/- fibroblasts cells. Related to images 3328, 3330, 3331, 3332, and 3333.
Rong Li and Praveen Suraneni, Stowers Institute for Medical Research
View Media
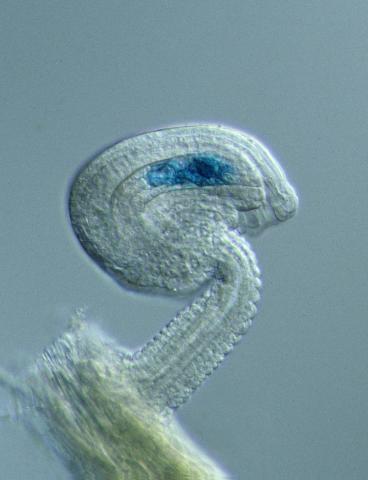
2418: Genetic imprinting in Arabidopsis
2418: Genetic imprinting in Arabidopsis
This delicate, birdlike projection is an immature seed of the Arabidopsis plant. The part in blue shows the cell that gives rise to the endosperm, the tissue that nourishes the embryo. The cell is expressing only the maternal copy of a gene called MEDEA. This phenomenon, in which the activity of a gene can depend on the parent that contributed it, is called genetic imprinting. In Arabidopsis, the maternal copy of MEDEA makes a protein that keeps the paternal copy silent and reduces the size of the endosperm. In flowering plants and mammals, this sort of genetic imprinting is thought to be a way for the mother to protect herself by limiting the resources she gives to any one embryo. Featured in the May 16, 2006, issue of Biomedical Beat.
Robert Fischer, University of California, Berkeley
View Media
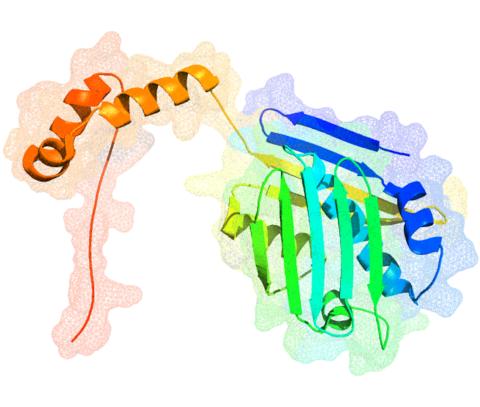
3660: Ribonuclease P structure
3660: Ribonuclease P structure
Ribbon diagram showing the structure of Ribonuclease P with tRNA.
PDB entry 3Q1Q, molecular modeling by Fred Friedman, NIGMS
View Media
6793: Yeast cells with endocytic actin patches
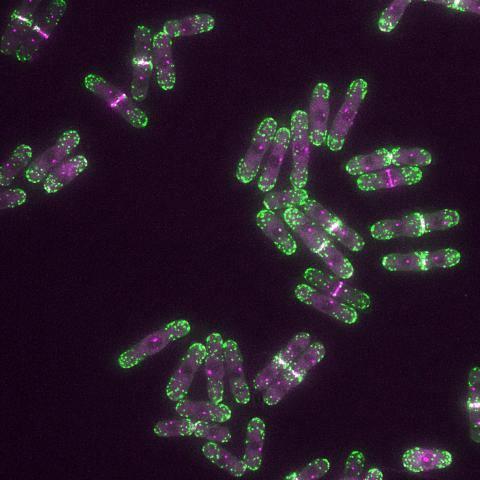
6793: Yeast cells with endocytic actin patches
Yeast cells with endocytic actin patches (green). These patches help cells take in outside material. When a cell is in interphase, patches concentrate at its ends. During later stages of cell division, patches move to where the cell splits. This image was captured using wide-field microscopy with deconvolution.
Related to images 6791, 6792, 6794, 6797, 6798, and videos 6795 and 6796.
Related to images 6791, 6792, 6794, 6797, 6798, and videos 6795 and 6796.
Alaina Willet, Kathy Gould’s lab, Vanderbilt University.
View Media
3753: Coronavirus spike protein structure
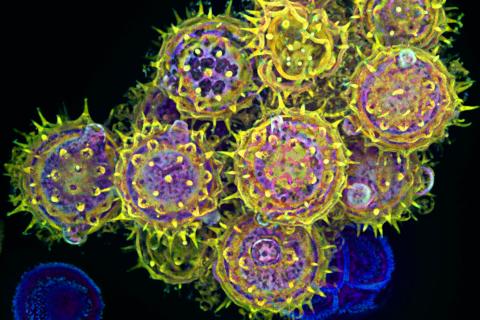
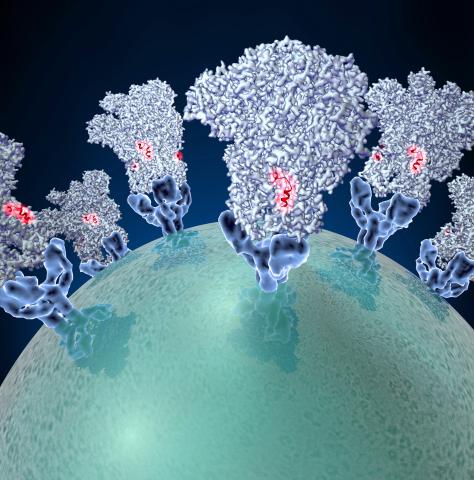
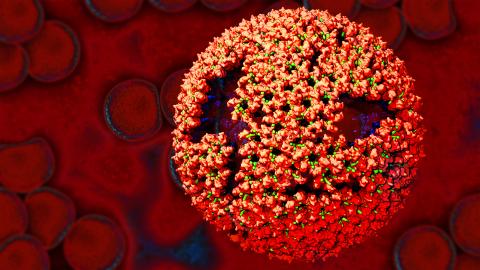
3753: Coronavirus spike protein structure
Coronaviruses are enveloped viruses responsible for 30 percent of mild respiratory infections and atypical deadly pneumonia in humans worldwide. These deadly pneumonia include those caused by infections with severe acute respiratory syndrome coronavirus (SARS-CoV) and Middle East respiratory syndrome coronavirus (MERS-CoV). The coronavirus spike glycoprotein mediates virus entry into cells and represents an important therapeutic target. The illustration shows a viral membrane decorated with spike glycoproteins; highlighted in red is a potential neutralization site, which is a protein sequence that might be used as a target for vaccines to combat viruses such as MERS-CoV and other coronaviruses.
Melody Campbell, UCSF
View Media
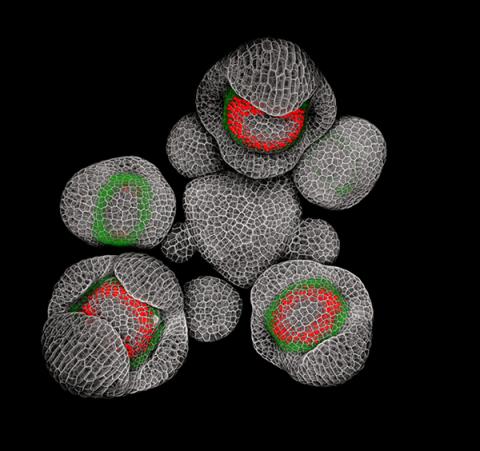
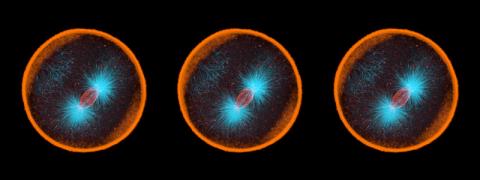
3743: Developing Arabidopsis flower buds
3743: Developing Arabidopsis flower buds
Flower development is a carefully orchestrated, genetically programmed process that ensures that the male (stamen) and female (pistil) organs form in the right place and at the right time in the flower. In this image of young Arabidopsis flower buds, the gene SUPERMAN (red) is activated at the boundary between the cells destined to form the male and female parts. SUPERMAN activity prevents the central cells, which will ultimately become the female pistil, from activating the gene APETALA3 (green), which induces formation of male flower organs. The goal of this research is to find out how plants maintain cells (called stem cells) that have the potential to develop into any type of cell and how genetic and environmental factors cause stem cells to develop and specialize into different cell types. This work informs future studies in agriculture, medicine and other fields.
Nathanaël Prunet, Caltech
View Media
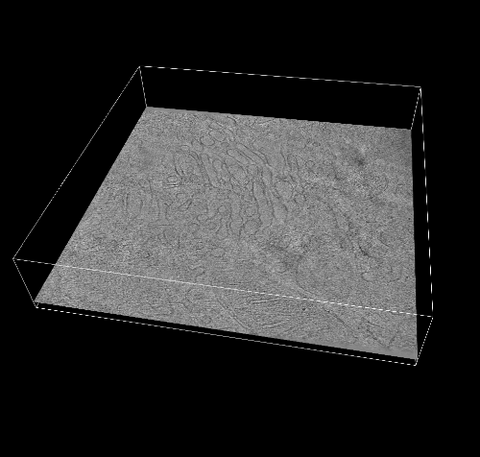
6609: 3D reconstruction of the Golgi apparatus in a pancreas cell
6609: 3D reconstruction of the Golgi apparatus in a pancreas cell
Researchers used cryo-electron tomography (cryo-ET) to capture images of a rat pancreas cell that were then compiled and color-coded to produce a 3D reconstruction. Visible features include the folded sacs of the Golgi apparatus (copper), transport vesicles (medium-sized dark-blue circles), microtubules (neon-green rods), a mitochondria membrane (pink), ribosomes (small pale-yellow circles), endoplasmic reticulum (aqua), and lysosomes (large yellowish-green circles). See 6606 for a still image from the video.
Xianjun Zhang, University of Southern California.
View Media
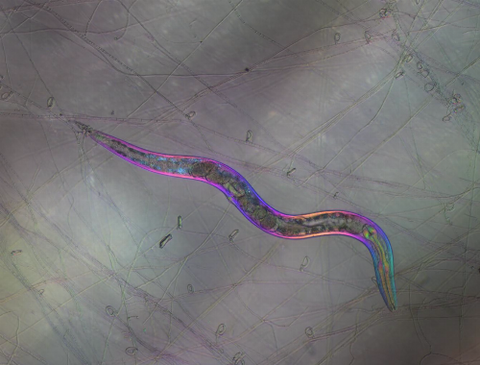
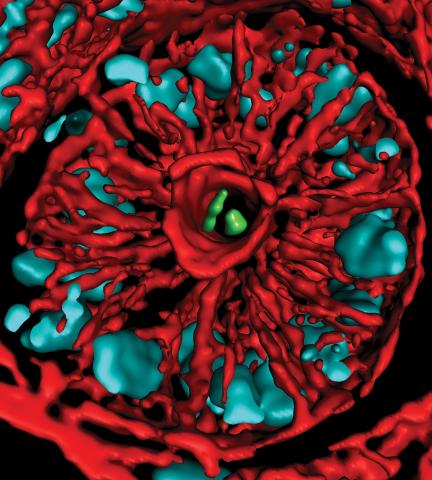
6963: C. elegans trapped by carnivorous fungus
6963: C. elegans trapped by carnivorous fungus
Real-time footage of Caenorhabditis elegans, a tiny roundworm, trapped by a carnivorous fungus, Arthrobotrys dactyloides. This fungus makes ring traps in response to the presence of C. elegans. When a worm enters a ring, the trap rapidly constricts so that the worm cannot move away, and the fungus then consumes the worm. The size of the imaged area is 0.7mm x 0.9mm.
This video was obtained with a polychromatic polarizing microscope (PPM) in white light that shows the polychromatic birefringent image with hue corresponding to the slow axis orientation. More information about PPM can be found in the Scientific Reports paper “Polychromatic Polarization Microscope: Bringing Colors to a Colorless World” by Shribak.
This video was obtained with a polychromatic polarizing microscope (PPM) in white light that shows the polychromatic birefringent image with hue corresponding to the slow axis orientation. More information about PPM can be found in the Scientific Reports paper “Polychromatic Polarization Microscope: Bringing Colors to a Colorless World” by Shribak.
Michael Shribak, Marine Biological Laboratory/University of Chicago.
View Media
3354: Hsp33 figure 1
3354: Hsp33 figure 1
Featured in the March 15, 2012 issue of Biomedical Beat. Related to Hsp33 Figure 2, image 3355.
Ursula Jakob and Dana Reichmann, University of Michigan
View Media
1056: Skin cross-section
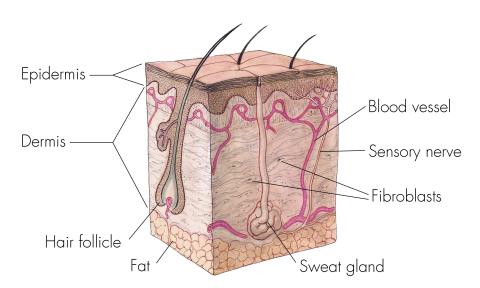
1056: Skin cross-section
Cross-section of skin anatomy shows layers and different tissue types.
National Institutes of Health Medical Arts
View Media
3646: Cells lining the trachea
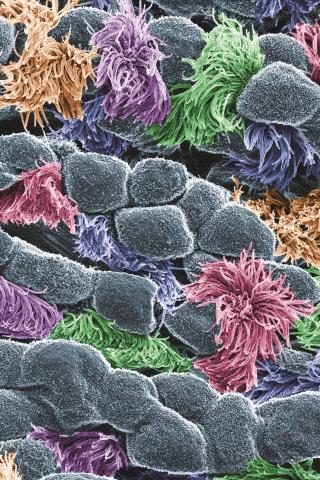
3646: Cells lining the trachea
In this image, viewed with a ZEISS ORION NanoFab microscope, the community of cells lining a mouse airway is magnified more than 10,000 times. This collection of cells, known as the mucociliary escalator, is also found in humans. It is our first line of defense against inhaled bacteria, allergens, pollutants, and debris. Malfunctions in the system can cause or aggravate lung infections and conditions such as asthma and chronic obstructive pulmonary disease. The cells shown in gray secrete mucus, which traps inhaled particles. The colored cells sweep the mucus layer out of the lungs.
This image was part of the Life: Magnified exhibit that ran from June 3, 2014, to January 21, 2015, at Dulles International Airport.
This image was part of the Life: Magnified exhibit that ran from June 3, 2014, to January 21, 2015, at Dulles International Airport.
Eva Mutunga and Kate Klein, University of the District of Columbia and National Institute of Standards and Technology
View Media
3771: Molecular model of freshly made Rous sarcoma virus (RSV)
3771: Molecular model of freshly made Rous sarcoma virus (RSV)
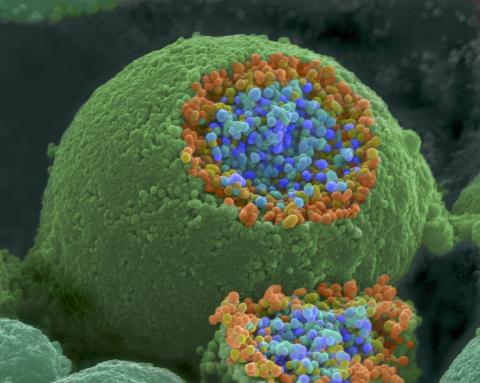
Viruses have been the foes of animals and other organisms for time immemorial. For almost as long, they've stayed well hidden from view because they are so tiny (they aren't even cells, so scientists call the individual virus a "particle"). This image shows a molecular model of a particle of the Rous sarcoma virus (RSV), a virus that infects and sometimes causes cancer in chickens. In the background is a photo of red blood cells. The particle shown is "immature" (not yet capable of infecting new cells) because it has just budded from an infected chicken cell and entered the bird's bloodstream. The outer shell of the immature virus is made up of a regular assembly of large proteins (shown in red) that are linked together with short protein molecules called peptides (green). This outer shell covers and protects the proteins (blue) that form the inner shell of the particle. But as you can see, the protective armor of the immature virus contains gaping holes. As the particle matures, the short peptides are removed and the large proteins rearrange, fusing together into a solid sphere capable of infecting new cells. While still immature, the particle is vulnerable to drugs that block its development. Knowing the structure of the immature particle may help scientists develop better medications against RSV and similar viruses in humans. Scientists used sophisticated computational tools to reconstruct the RSV atomic structure by crunching various data on the RSV proteins to simulate the entire structure of immature RSV.
Boon Chong Goh, University of Illinois at Urbana-Champaign
View Media
1082: Natcher Building 02
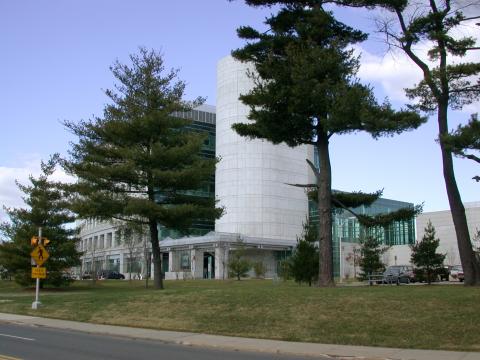
1082: Natcher Building 02
NIGMS staff are located in the Natcher Building on the NIH campus.
Alisa Machalek, National Institute of General Medical Sciences
View Media
5825: A Growing Bacterial Biofilm
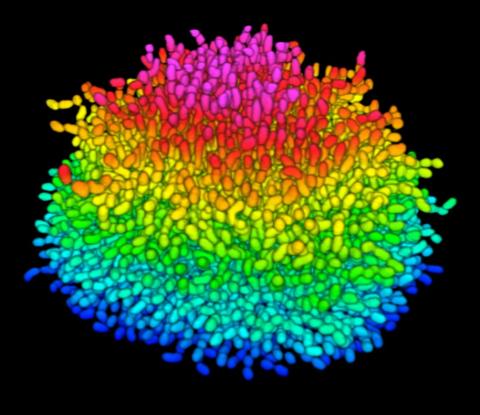
5825: A Growing Bacterial Biofilm
A growing Vibrio cholerae (cholera) biofilm. Cholera bacteria form colonies called biofilms that enable them to resist antibiotic therapy within the body and other challenges to their growth.
Each slightly curved comma shape represents an individual bacterium from assembled confocal microscopy images. Different colors show each bacterium’s position in the biofilm in relation to the surface on which the film is growing.
Each slightly curved comma shape represents an individual bacterium from assembled confocal microscopy images. Different colors show each bacterium’s position in the biofilm in relation to the surface on which the film is growing.
Jing Yan, Ph.D., and Bonnie Bassler, Ph.D., Department of Molecular Biology, Princeton University, Princeton, NJ.
View Media
7014: Flagellated bacterial cells
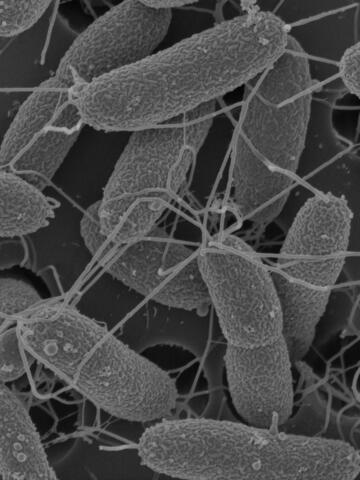
7014: Flagellated bacterial cells
Vibrio fischeri (2 mm in length) is the exclusive symbiotic partner of the Hawaiian bobtail squid, Euprymna scolopes. After this bacterium uses its flagella to swim from the seawater into the light organ of a newly hatched juvenile, it colonizes the host and loses the appendages. This image was taken using a scanning electron microscope.
Margaret J. McFall-Ngai, Carnegie Institution for Science/California Institute of Technology, and Edward G. Ruby, California Institute of Technology.
View Media