
Switch to List View
Image and Video Gallery
This is a searchable collection of scientific photos, illustrations, and videos. The images and videos in this gallery are licensed under Creative Commons Attribution Non-Commercial ShareAlike 3.0. This license lets you remix, tweak, and build upon this work non-commercially, as long as you credit and license your new creations under identical terms.
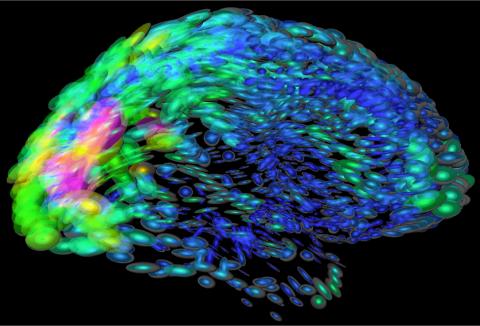
2419: Mapping brain differences
2419: Mapping brain differences
This image of the human brain uses colors and shapes to show neurological differences between two people. The blurred front portion of the brain, associated with complex thought, varies most between the individuals. The blue ovals mark areas of basic function that vary relatively little. Visualizations like this one are part of a project to map complex and dynamic information about the human brain, including genes, enzymes, disease states, and anatomy. The brain maps represent collaborations between neuroscientists and experts in math, statistics, computer science, bioinformatics, imaging, and nanotechnology.
Arthur Toga, University of California, Los Angeles
View Media
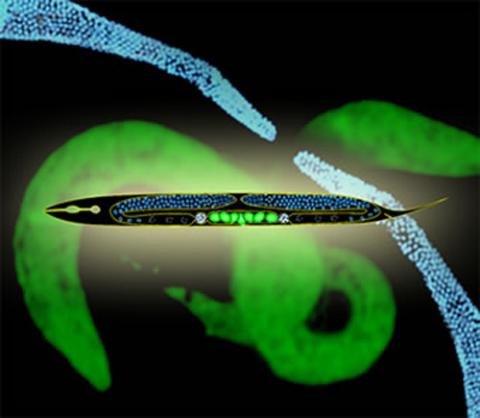
2333: Worms and human infertility
2333: Worms and human infertility
This montage of tiny, transparent C. elegans--or roundworms--may offer insight into understanding human infertility. Researchers used fluorescent dyes to label the worm cells and watch the process of sex cell division, called meiosis, unfold as nuclei (blue) move through the tube-like gonads. Such visualization helps the scientists identify mechanisms that enable these roundworms to reproduce successfully. Because meiosis is similar in all sexually reproducing organisms, what the scientists learn could apply to humans.
Abby Dernburg, Lawrence Berkeley National Laboratory
View Media
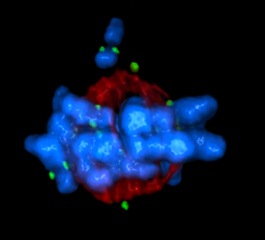
5765: Mitotic cell awaits chromosome alignment
5765: Mitotic cell awaits chromosome alignment
During mitosis, spindle microtubules (red) attach to chromosome pairs (blue), directing them to the spindle equator. This midline alignment is critical for equal distribution of chromosomes in the dividing cell. Scientists are interested in how the protein kinase Plk1 (green) regulates this activity in human cells. Image is a volume projection of multiple deconvolved z-planes acquired with a Nikon widefield fluorescence microscope. This image was chosen as a winner of the 2016 NIH-funded research image call. Related to image 5766.
The research that led to this image was funded by NIGMS.
View Media
The research that led to this image was funded by NIGMS.
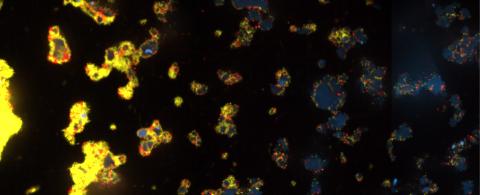
3580: V. Cholerae Biofilm
3580: V. Cholerae Biofilm
Industrious V. cholerae bacteria (yellow) tend to thrive in denser biofilms (left) while moochers (red) thrive in weaker biofilms (right). More information about the research behind this image can be found in a Biomedical Beat Blog posting from February 2014.
View Media
3630: Three muscle fibers; the middle has a defect found in some neuromuscular diseases
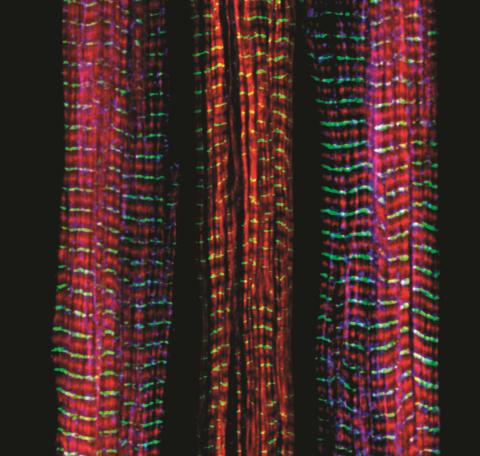
3630: Three muscle fibers; the middle has a defect found in some neuromuscular diseases
Of the three muscle fibers shown here, the one on the right and the one on the left are normal. The middle fiber is deficient a large protein called nebulin (blue). Nebulin plays a number of roles in the structure and function of muscles, and its absence is associated with certain neuromuscular disorders.
This image was part of the Life: Magnified exhibit that ran from June 3, 2014, to January 21, 2015, at Dulles International Airport.
This image was part of the Life: Magnified exhibit that ran from June 3, 2014, to January 21, 2015, at Dulles International Airport.
Christopher Pappas and Carol Gregorio, University of Arizona
View Media
5762: Panorama view of golden mitochondria
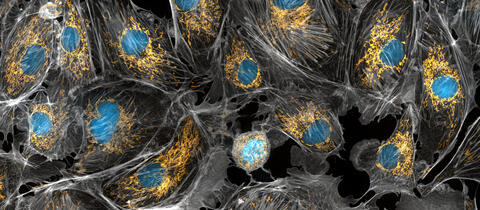
5762: Panorama view of golden mitochondria
Mitochondria are the powerhouses of the cells, generating the energy the cells need to do their tasks and to stay alive. Researchers have studied mitochondria for some time because when these cell organelles don't work as well as they should, several diseases develop. In this photograph of cow cells taken with a microscope, the mitochondria were stained in bright yellow to visualize them in the cell. The large blue dots are the cell nuclei and the gray web is the cytoskeleton of the cells.
Torsten Wittmann, University of California, San Francisco
View Media
2626: Telomeres
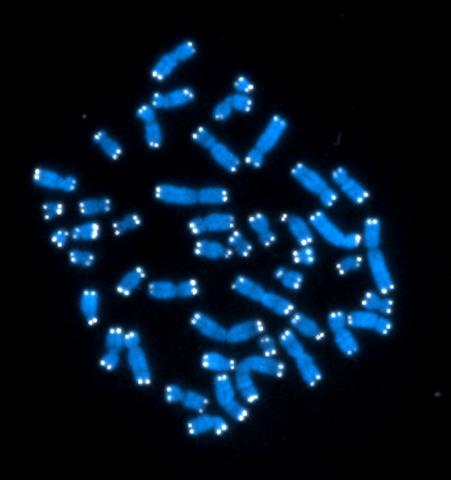
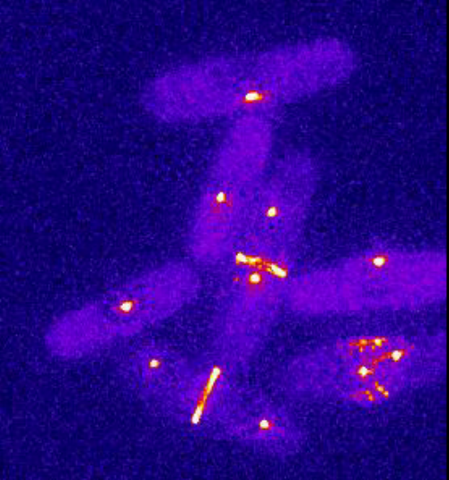
2626: Telomeres
The 46 human chromosomes are shown in blue, with the telomeres appearing as white pinpoints. The DNA has already been copied, so each chromosome is actually made up of two identical lengths of DNA, each with its own two telomeres.
Hesed Padilla-Nash and Thomas Ried, the National Cancer Institute, a part of NIH
View Media
1021: Lily mitosis 08
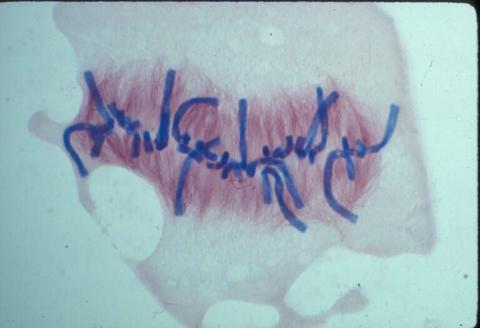
1021: Lily mitosis 08
A light microscope image of a cell from the endosperm of an African globe lily (Scadoxus katherinae). This is one frame of a time-lapse sequence that shows cell division in action. The lily is considered a good organism for studying cell division because its chromosomes are much thicker and easier to see than human ones. Staining shows microtubules in red and chromosomes in blue. Here, condensed chromosomes are clearly visible and lined up.
Related to images 1010, 1011, 1012, 1013, 1014, 1015, 1016, 1017, 1018, and 1019.
Related to images 1010, 1011, 1012, 1013, 1014, 1015, 1016, 1017, 1018, and 1019.
Andrew S. Bajer, University of Oregon, Eugene
View Media
2347: Cysteine dioxygenase from mouse
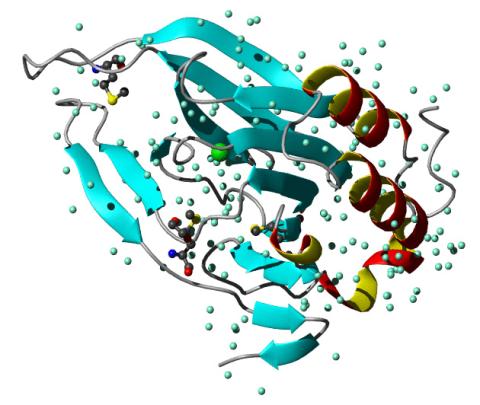
2347: Cysteine dioxygenase from mouse
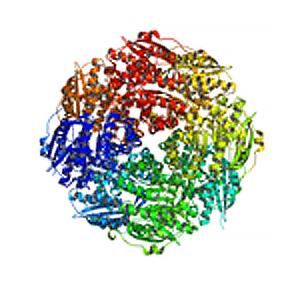
Model of the mammalian iron enzyme cysteine dioxygenase from a mouse.
Center for Eukaryotic Structural Genomics, PSI
View Media
3763: The 26S proteasome engages with a protein substrate
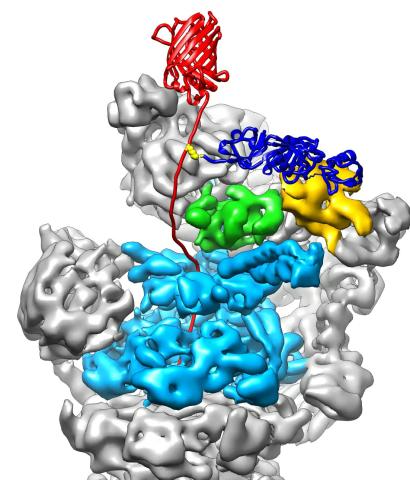
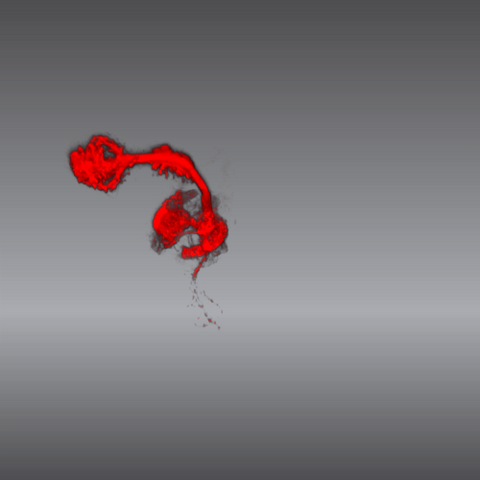
3763: The 26S proteasome engages with a protein substrate
The proteasome is a critical multiprotein complex in the cell that breaks down and recycles proteins that have become damaged or are no longer needed. This illustration shows a protein substrate (red) that is bound through its ubiquitin chain (blue) to one of the ubiquitin receptors of the proteasome (Rpn10, yellow). The substrate's flexible engagement region gets engaged by the AAA+ motor of the proteasome (cyan), which initiates mechanical pulling, unfolding and movement of the protein into the proteasome's interior for cleavage into small shorter protein pieces called peptides. During movement of the substrate, its ubiquitin modification gets cleaved off by the deubiquitinase Rpn11 (green), which sits directly above the entrance to the AAA+ motor pore and acts as a gatekeeper to ensure efficient ubiquitin removal, a prerequisite for fast protein breakdown by the 26S proteasome. Related to video 3764.
Andreas Martin, HHMI
View Media
2386: Sortase b from B. anthracis
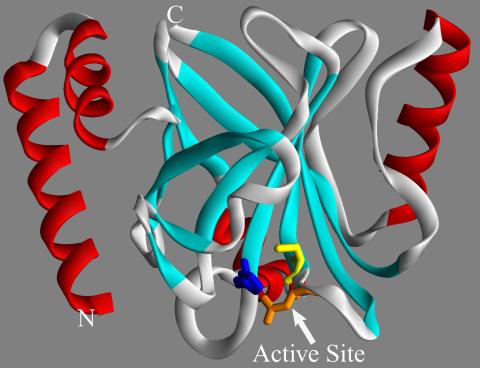
2386: Sortase b from B. anthracis
Structure of sortase b from the bacterium B. anthracis, which causes anthrax. Sortase b is an enzyme used to rob red blood cells of iron, which the bacteria need to survive.
Midwest Center for Structural Genomics, PSI
View Media
2331: Statistical cartography
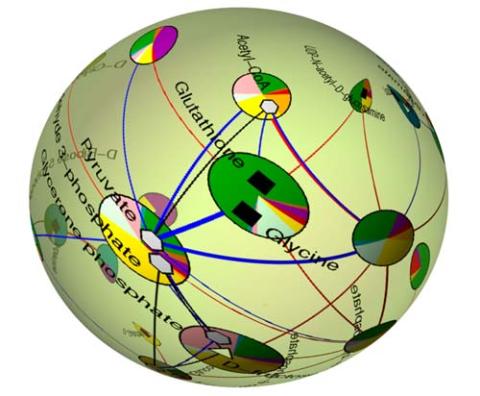
2331: Statistical cartography
Like a world of its own, this sphere represents all the known chemical reactions in the E. coli bacterium. The colorful circles on the surface symbolize sets of densely interconnected reactions. The lines between the circles show additional connecting reactions. The shapes inside the circles are landmark molecules, like capital cities on a map, that either act as hubs for many groups of reactions, are highly conserved among species, or both. Molecules that connect far-flung reactions on the sphere are much more conserved during evolution than molecules that connect reactions within a single circle. This statistical cartography could reveal insights about other complex systems, such as protein interactions and gene regulation networks.
Luis A. Nunes Amaral, Northwestern University
View Media
6893: Chromatin in human tenocyte
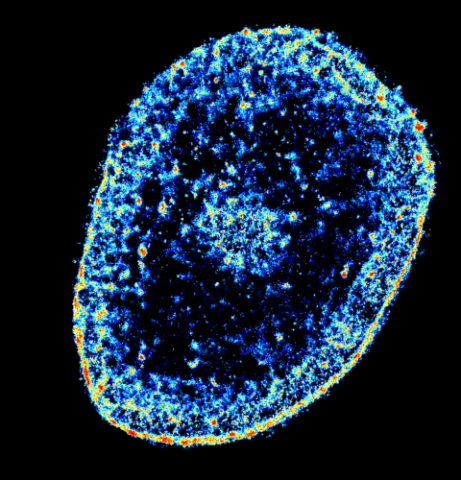
6893: Chromatin in human tenocyte
The nucleus of a degenerating human tendon cell, also known as a tenocyte. It has been color-coded based on the density of chromatin—a substance made up of DNA and proteins. Areas of low chromatin density are shown in blue, and areas of high chromatin density are shown in red. This image was captured using Stochastic Optical Reconstruction Microscopy (STORM).
Related to images 6887 and 6888.
Related to images 6887 and 6888.
Melike Lakadamyali, Perelman School of Medicine at the University of Pennsylvania.
View Media
5843: Color coding of the Drosophila brain - video
5843: Color coding of the Drosophila brain - video
This video results from a research project to visualize which regions of the adult fruit fly (Drosophila) brain derive from each neural stem cell. First, researchers collected several thousand fruit fly larvae and fluorescently stained a random stem cell in the brain of each. The idea was to create a population of larvae in which each of the 100 or so neural stem cells was labeled at least once. When the larvae grew to adults, the researchers examined the flies’ brains using confocal microscopy. With this technique, the part of a fly’s brain that derived from a single, labeled stem cell “lights up.” The scientists photographed each brain and digitally colorized its lit-up area. By combining thousands of such photos, they created a three-dimensional, color-coded map that shows which part of the Drosophila brain comes from each of its ~100 neural stem cells. In other words, each colored region shows which neurons are the progeny or “clones” of a single stem cell. This work established a hierarchical structure as well as nomenclature for the neurons in the Drosophila brain. Further research will relate functions to structures of the brain.
Related to images 5838 and 5868.
Related to images 5838 and 5868.
Yong Wan from Charles Hansen’s lab, University of Utah. Data preparation and visualization by Masayoshi Ito in the lab of Kei Ito, University of Tokyo.
View Media
2791: Anti-tumor drug ecteinascidin 743 (ET-743) with hydrogens 02
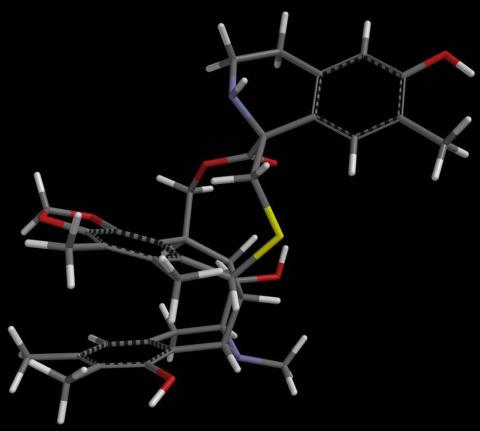
2791: Anti-tumor drug ecteinascidin 743 (ET-743) with hydrogens 02
Ecteinascidin 743 (ET-743, brand name Yondelis), was discovered and isolated from a sea squirt, Ecteinascidia turbinata, by NIGMS grantee Kenneth Rinehart at the University of Illinois. It was synthesized by NIGMS grantees E.J. Corey and later by Samuel Danishefsky. Multiple versions of this structure are available as entries 2790-2797.
Timothy Jamison, Massachusetts Institute of Technology
View Media

5815: Introduction to Genome Editing Using CRISPR/Cas9
5815: Introduction to Genome Editing Using CRISPR/Cas9
Genome editing using CRISPR/Cas9 is a rapidly expanding field of scientific research with emerging applications in disease treatment, medical therapeutics and bioenergy, just to name a few. This technology is now being used in laboratories all over the world to enhance our understanding of how living biological systems work, how to improve treatments for genetic diseases and how to develop energy solutions for a better future.
Janet Iwasa
View Media
1274: Animal cell
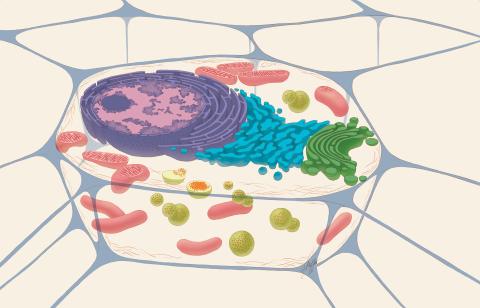
1274: Animal cell
A typical animal cell, sliced open to reveal a cross-section of organelles.
Judith Stoffer
View Media
5888: Independence Day
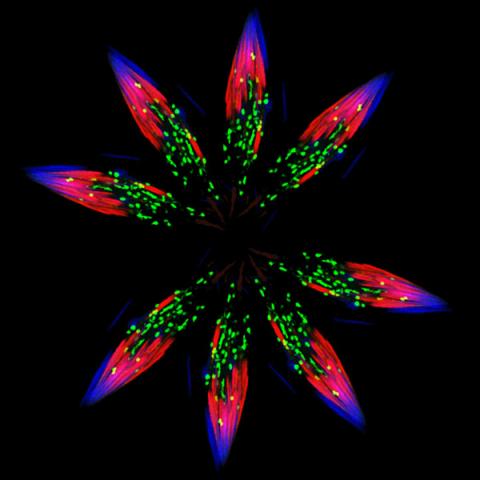
5888: Independence Day
This graphic that resembles a firework was created from a picture of a fruit fly spermatid. This fruit fly spermatid recycles various molecules, including malformed or damaged proteins. Actin filaments (red) in the cell draw unwanted proteins toward a barrel-shaped structure called the proteasome (green clusters), which degrades the molecules into their basic parts for re-use.
Sigi Benjamin-Hong, Rockefeller University
View Media
6800: Magnetic Janus particle activating a T cell
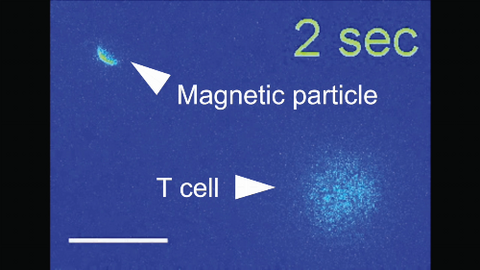
6800: Magnetic Janus particle activating a T cell
A Janus particle being used to activate a T cell, a type of immune cell. A Janus particle is a specialized microparticle with different physical properties on its surface, and this one is coated with nickel on one hemisphere and anti-CD3 antibodies (light blue) on the other. The nickel enables the Janus particle to be moved using a magnet, and the antibodies bind to the T cell and activate it. The T cell in this video was loaded with calcium-sensitive dye to visualize calcium influx, which indicates activation. The intensity of calcium influx was color coded so that warmer color indicates higher intensity. Being able to control Janus particles with simple magnets is a step toward controlling individual cells’ activities without complex magnetic devices.
More details can be found in the Angewandte Chemie paper “Remote control of T cell activation using magnetic Janus particles” by Lee et al. This video was captured using epi-fluorescence microscopy.
Related to video 6801.
More details can be found in the Angewandte Chemie paper “Remote control of T cell activation using magnetic Janus particles” by Lee et al. This video was captured using epi-fluorescence microscopy.
Related to video 6801.
Yan Yu, Indiana University, Bloomington.
View Media
5886: Mouse Brain Cross Section
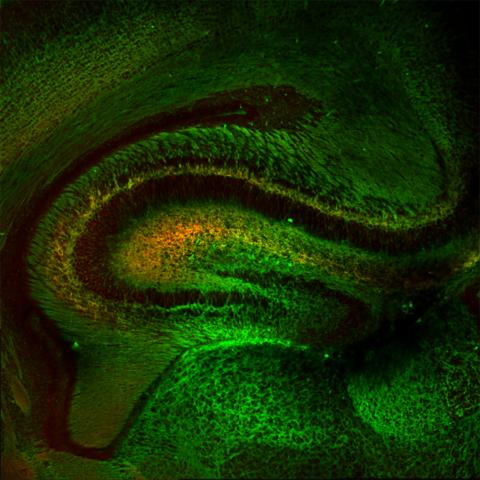
5886: Mouse Brain Cross Section
The brain sections are treated with fluorescent antibodies specific to a particular protein and visualized using serial electron microscopy (SEM).
Anton Maximov, The Scripps Research Institute, La Jolla, CA
View Media
3339: Single-Molecule Imaging
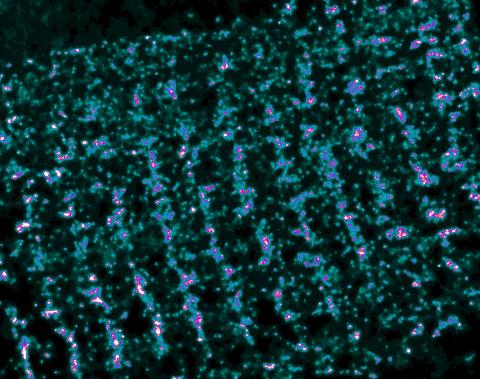
3339: Single-Molecule Imaging
This is a super-resolution light microscope image taken by Hiro Hakozaki and Masa Hoshijima of NCMIR. The image contains highlighted calcium channels in cardiac muscle using a technique called dSTORM. The microscope used in the NCMIR lab was built by Hiro Hakozaki.
Tom Deerinck, NCMIR
View Media
2337: Beta2-adrenergic receptor protein
2337: Beta2-adrenergic receptor protein
Crystal structure of the beta2-adrenergic receptor protein. This is the first known structure of a human G protein-coupled receptor, a large family of proteins that control critical bodily functions and the action of about half of today's pharmaceuticals. Featured as one of the November 2007 Protein Structure Initiative Structures of the Month.
The Stevens Laboratory, The Scripps Research Institute
View Media
2412: Pig alpha amylase
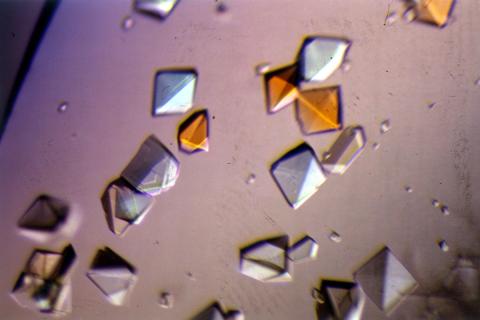
2412: Pig alpha amylase
Crystals of porcine alpha amylase protein created for X-ray crystallography, which can reveal detailed, three-dimensional protein structures.
Alex McPherson, University of California, Irvine
View Media
6602: See how immune cell acid destroys bacterial proteins
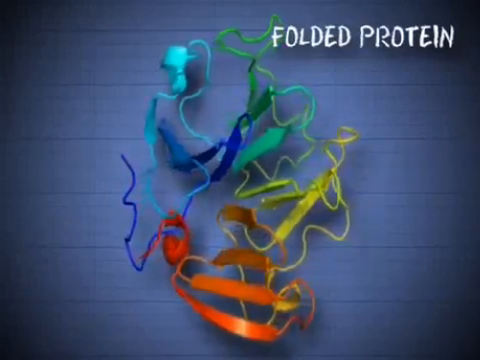
6602: See how immune cell acid destroys bacterial proteins
This animation shows the effect of exposure to hypochlorous acid, which is found in certain types of immune cells, on bacterial proteins. The proteins unfold and stick to one another, leading to cell death.
American Chemistry Council
View Media
2411: Fungal lipase (2)
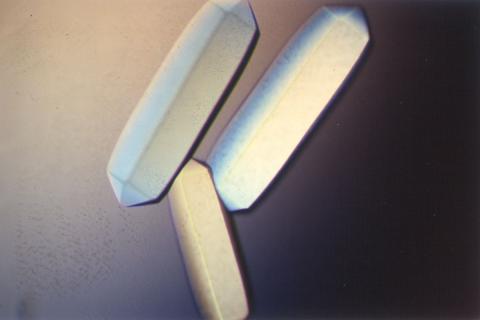
2411: Fungal lipase (2)
Crystals of fungal lipase protein created for X-ray crystallography, which can reveal detailed, three-dimensional protein structures.
Alex McPherson, University of California, Irvine
View Media
2606: Induced stem cells from adult skin 04
2606: Induced stem cells from adult skin 04
The human skin cells pictured contain genetic modifications that make them pluripotent, essentially equivalent to embryonic stem cells. A scientific team from the University of Wisconsin-Madison including researchers Junying Yu, James Thomson, and their colleagues produced the transformation by introducing a set of four genes into human fibroblasts, skin cells that are easy to obtain and grow in culture.
James Thomson, University of Wisconsin-Madison
View Media
6751: Petri dish containing C. elegans
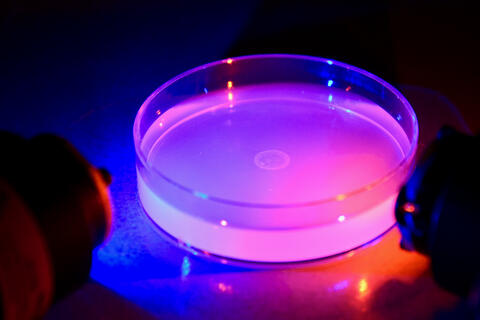
6751: Petri dish containing C. elegans
This Petri dish contains microscopic roundworms called Caenorhabditis elegans. Researchers used these particular worms to study how C. elegans senses the color of light in its environment.
H. Robert Horvitz and Dipon Ghosh, Massachusetts Institute of Technology.
View Media
6613: Circadian rhythms and the SCN
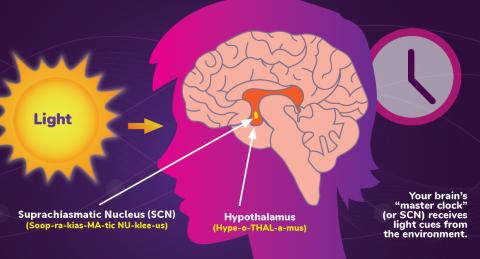
6613: Circadian rhythms and the SCN
Circadian rhythms are physical, mental, and behavioral changes that follow a 24-hour cycle. Circadian rhythms are influenced by light and regulated by the brain’s suprachiasmatic nucleus (SCN), sometimes referred to as a master clock. Learn more in NIGMS’ circadian rhythms fact sheet. See 6614 for the Spanish version of this infographic.
NIGMS
View Media
2559: RNA interference (with labels)
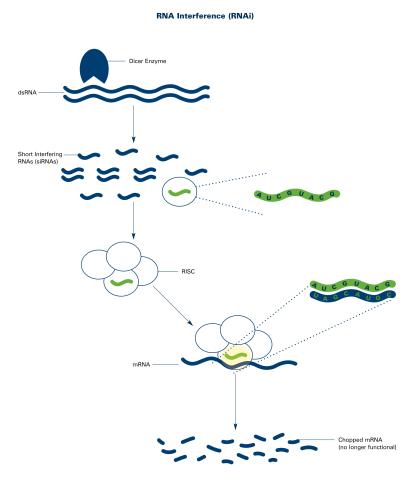
2559: RNA interference (with labels)
RNA interference or RNAi is a gene-silencing process in which double-stranded RNAs trigger the destruction of specific RNAs. See 2558 for an unlabeled version of this illustration. Featured in The New Genetics.
Crabtree + Company
View Media
5759: TEM cross-section of C. elegans (roundworm)
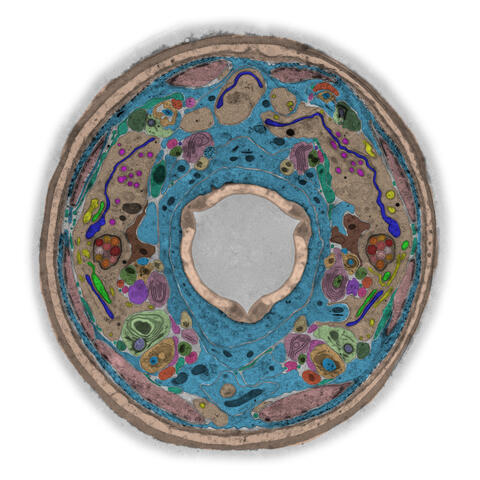
5759: TEM cross-section of C. elegans (roundworm)
The worm Caenorhabditis elegans is a popular laboratory animal because its small size and fairly simple body make it easy to study. Scientists use this small worm to answer many research questions in developmental biology, neurobiology, and genetics. This image, which was taken with transmission electron microscopy (TEM), shows a cross-section through C. elegans, revealing various internal structures.
The image is from a figure in an article published in the journal eLife. There is an annotated version of this graphic at 5760.
The image is from a figure in an article published in the journal eLife. There is an annotated version of this graphic at 5760.
Piali Sengupta, Brandeis University
View Media
2781: Disease-resistant Arabidopsis leaf
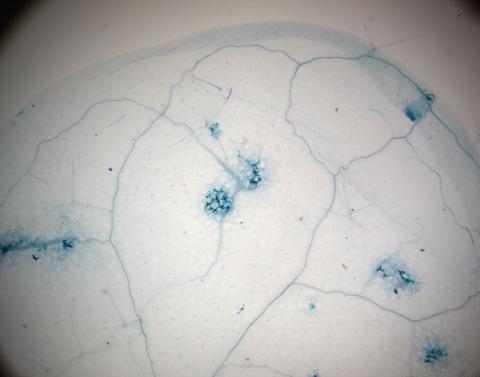
2781: Disease-resistant Arabidopsis leaf
This is a magnified view of an Arabidopsis thaliana leaf a few days after being exposed to the pathogen Hyaloperonospora arabidopsidis. The plant from which this leaf was taken is genetically resistant to the pathogen. The spots in blue show areas of localized cell death where infection occurred, but it did not spread. Compare this response to that shown in Image 2782. Jeff Dangl has been funded by NIGMS to study the interactions between pathogens and hosts that allow or suppress infection.
Jeff Dangl, University of North Carolina, Chapel Hill
View Media
3519: HeLa cells
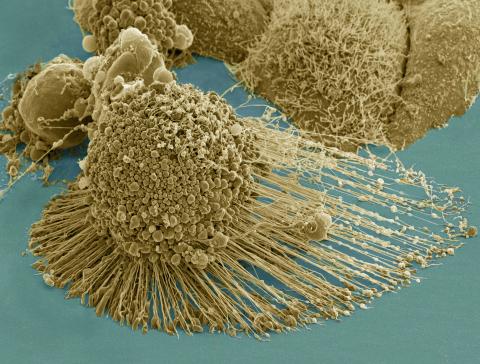
3519: HeLa cells
Scanning electron micrograph of an apoptotic HeLa cell. Zeiss Merlin HR-SEM. See related images 3518, 3520, 3521, 3522.
National Center for Microscopy and Imaging Research
View Media
7004: Protein kinases as cancer chemotherapy targets
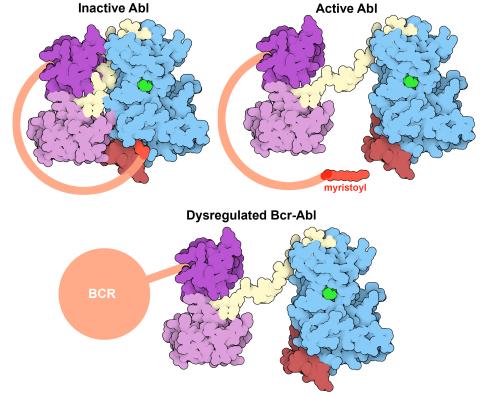
7004: Protein kinases as cancer chemotherapy targets
Protein kinases—enzymes that add phosphate groups to molecules—are cancer chemotherapy targets because they play significant roles in almost all aspects of cell function, are tightly regulated, and contribute to the development of cancer and other diseases if any alterations to their regulation occur. Genetic abnormalities affecting the c-Abl tyrosine kinase are linked to chronic myelogenous leukemia, a cancer of immature cells in the bone marrow. In the noncancerous form of the protein, binding of a myristoyl group to the kinase domain inhibits the activity of the protein until it is needed (top left shows the inactive form, top right shows the open and active form). The cancerous variant of the protein, called Bcr-Abl, lacks this autoinhibitory myristoyl group and is continually active (bottom). ATP is shown in green bound in the active site of the kinase.
Find these in the RCSB Protein Data Bank: c-Abl tyrosine kinase and regulatory domains (PDB entry 1OPL) and F-actin binding domain (PDB entry 1ZZP).
Find these in the RCSB Protein Data Bank: c-Abl tyrosine kinase and regulatory domains (PDB entry 1OPL) and F-actin binding domain (PDB entry 1ZZP).
Amy Wu and Christine Zardecki, RCSB Protein Data Bank.
View Media
6344: Drosophila
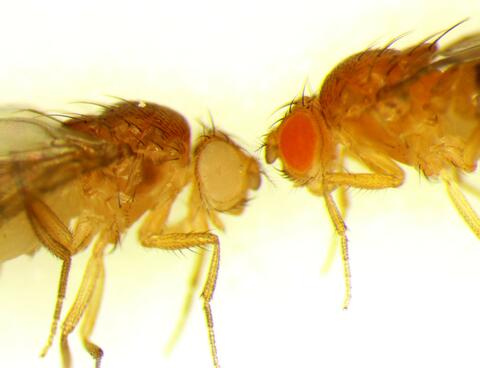
6344: Drosophila
Two adult fruit flies (Drosophila)
Dr. Vicki Losick, MDI Biological Laboratory, www.mdibl.org
View Media
2365: Map of protein structures 01
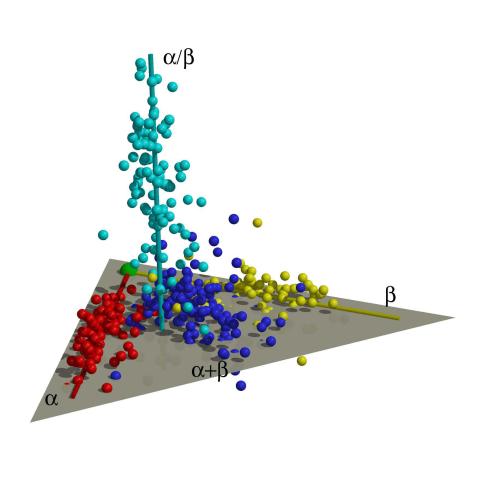
2365: Map of protein structures 01
A global "map of the protein structure universe." The Berkeley Structural Genomics Center has developed a method to visualize the vast universe of protein structures in which proteins of similar structure are located close together and those of different structures far away in the space. This map, constructed using about 500 of the most common protein folds, reveals a highly non-uniform distribution, and shows segregation between four elongated regions corresponding to four different protein classes (shown in four different colors). Such a representation reveals a high-level of organization of the protein structure universe.
Berkeley Structural Genomics Center, PSI
View Media
6598: Simulation of leg muscles moving
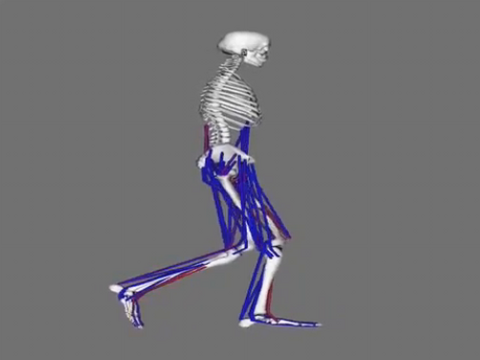
6598: Simulation of leg muscles moving
When we walk, muscles and nerves interact in intricate ways. This simulation, which is based on data from a six-foot-tall man, shows these interactions.
Chand John and Eran Guendelman, Stanford University
View Media
2608: Human embryonic stem cells
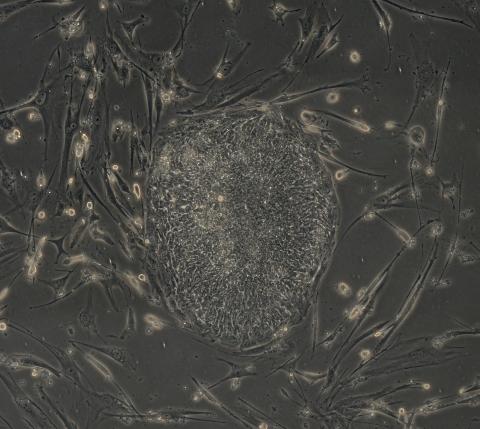
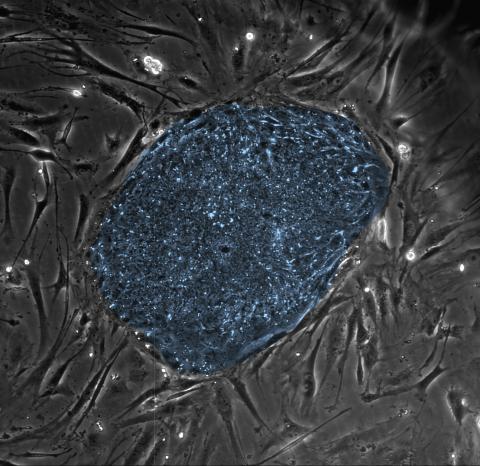
2608: Human embryonic stem cells
The center cluster of cells, colored blue, shows a colony of human embryonic stem cells. These cells, which arise at the earliest stages of development, are capable of differentiating into any of the 220 types of cells in the human body and can provide access to cells for basic research and potential therapies. This image is from the lab of the University of Wisconsin-Madison's James Thomson.
James Thomson, University of Wisconsin-Madison
View Media
1310: Cell cycle wheel
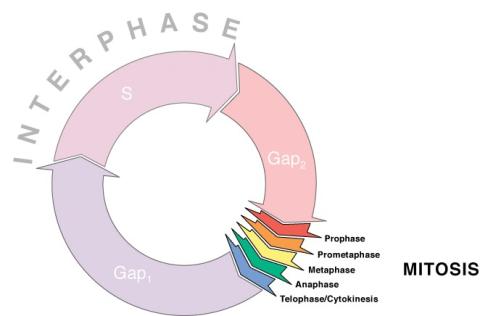
1310: Cell cycle wheel
A typical animal cell cycle lasts roughly 24 hours, but depending on the type of cell, it can vary in length from less than 8 hours to more than a year. Most of the variability occurs in Gap1. Appears in the NIGMS booklet Inside the Cell.
Judith Stoffer
View Media
2724: Blinking bacteria
2724: Blinking bacteria
Like a pulsing blue shower, E. coli cells flash in synchrony. Genes inserted into each cell turn a fluorescent protein on and off at regular intervals. When enough cells grow in the colony, a phenomenon called quorum sensing allows them to switch from blinking independently to blinking in unison. Researchers can watch waves of light propagate across the colony. Adjusting the temperature, chemical composition or other conditions can change the frequency and amplitude of the waves. Because the blinks react to subtle changes in the environment, synchronized oscillators like this one could one day allow biologists to build cellular sensors that detect pollutants or help deliver drugs.
Jeff Hasty, University of California, San Diego
View Media
2409: Bacterial glucose isomerase
2409: Bacterial glucose isomerase
A crystal of bacterial glucose isomerase protein created for X-ray crystallography, which can reveal detailed, three-dimensional protein structures.
Alex McPherson, University of California, Irvine
View Media
5756: Pigment cells in fish skin
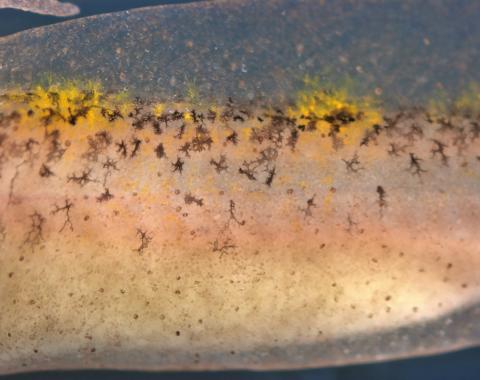
5756: Pigment cells in fish skin
Pigment cells are cells that give skin its color. In fishes and amphibians, like frogs and salamanders, pigment cells are responsible for the characteristic skin patterns that help these organisms to blend into their surroundings or attract mates. The pigment cells are derived from neural crest cells, which are cells originating from the neural tube in the early embryo. This image shows pigment cells from pearl danio, a relative of the popular laboratory animal zebrafish. Investigating pigment cell formation and migration in animals helps answer important fundamental questions about the factors that control pigmentation in the skin of animals, including humans. Related to images 5754, 5755, 5757 and 5758.
David Parichy, University of Washington
View Media
2503: Focal adhesions (with labels)
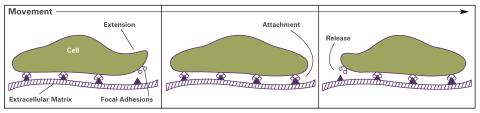
2503: Focal adhesions (with labels)
Cells walk along body surfaces via tiny "feet," called focal adhesions, that connect with the extracellular matrix. See image 2502 for an unlabeled version of this illustration.
Crabtree + Company
View Media
2350: Mandelate racemase from B. subtilis
2350: Mandelate racemase from B. subtilis
Model of the mandelate racemase enzyme from Bacillus subtilis, a bacterium commonly found in soil.
New York Structural GenomiX Research Consortium, PSI
View Media
2361: Chromium X-ray source
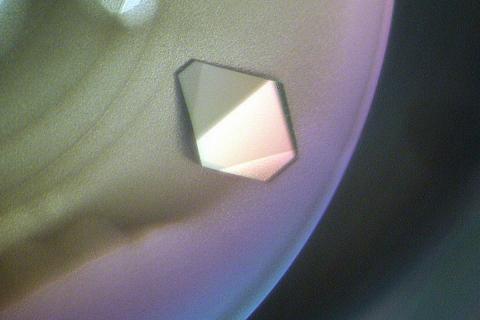
2361: Chromium X-ray source
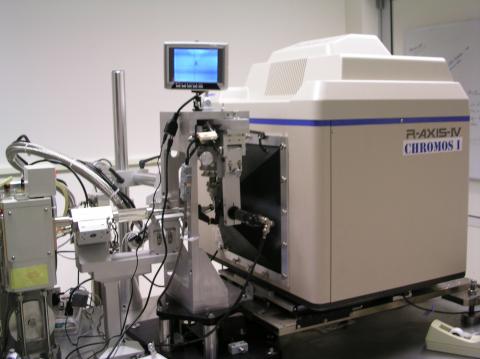
In the determination of protein structures by X-ray crystallography, this unique soft (l = 2.29Å) X-ray source is used to collect anomalous scattering data from protein crystals containing light atoms such as sulfur, calcium, zinc and phosphorous. These data can be used to image the protein.
The Southeast Collaboratory for Structural Genomics
View Media
1312: Cell toxins
1312: Cell toxins
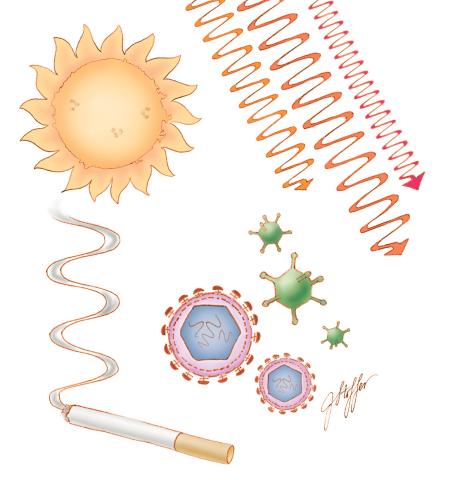
A number of environmental factors cause DNA mutations that can lead to cancer: toxins in cigarette smoke, sunlight and other radiation, and some viruses.
Judith Stoffer
View Media
2748: Early ribbon drawing of a protein
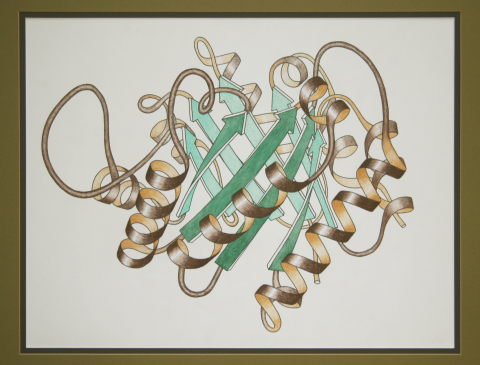
2748: Early ribbon drawing of a protein
This ribbon drawing of a protein hand drawn and colored by researcher Jane Richardson in 1981 helped originate the ribbon representation of proteins that is now ubiquitous in molecular graphics. The drawing shows the 3-dimensional structure of the protein triose phosphate isomerase. The green arrows represent the barrel of eight beta strands in this structure and the brown spirals show the protein's eight alpha helices. A black and white version of this drawing originally illustrated a review article in Advances in Protein Chemistry, volume 34, titled "Anatomy and Taxonomy of Protein Structures." The illustration was selected as Picture of The Day on the English Wikipedia for November 19, 2009. Other important and beautiful images of protein structures by Jane Richardson are available in her Wikimedia gallery.
Jane Richardson, Duke University Medical Center
View Media
6611: Average teen circadian cycle
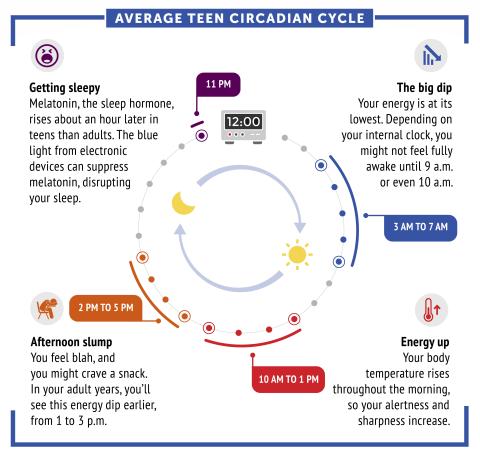
6611: Average teen circadian cycle
Circadian rhythms are physical, mental, and behavioral changes that follow a 24-hour cycle. Typical circadian rhythms lead to high energy during the middle of the day (10 a.m. to 1 p.m.) and an afternoon slump. At night, circadian rhythms cause the hormone melatonin to rise, making a person sleepy.
Learn more in NIGMS’ circadian rhythms featured topics page.
See 6612 for the Spanish version of this infographic.
Learn more in NIGMS’ circadian rhythms featured topics page.
See 6612 for the Spanish version of this infographic.
NIGMS
View Media
6796: Dividing yeast cells with spindle pole bodies and contractile rings
6796: Dividing yeast cells with spindle pole bodies and contractile rings
During cell division, spindle pole bodies (glowing dots) move toward the ends of yeast cells to separate copied genetic information. Contractile rings (glowing bands) form in cells’ middles and constrict to help them split. This time-lapse video was captured using wide-field microscopy with deconvolution.
Related to images 6791, 6792, 6793, 6794, 6797, 6798, and video 6795.
Related to images 6791, 6792, 6793, 6794, 6797, 6798, and video 6795.
Alaina Willet, Kathy Gould’s lab, Vanderbilt University.
View Media
3573: Myotonic dystrophy type 2 genetic defect
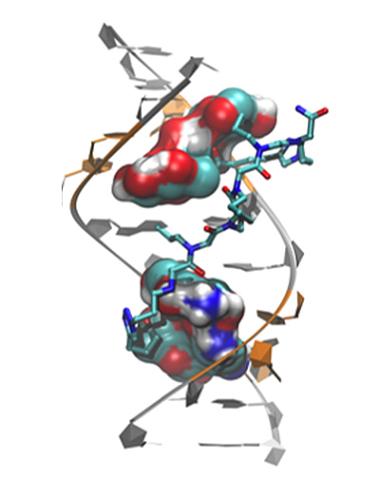
3573: Myotonic dystrophy type 2 genetic defect
Scientists revealed a detailed image of the genetic defect that causes myotonic dystrophy type 2 and used that information to design drug candidates to counteract the disease.
Matthew Disney, Scripps Research Institute and Ilyas Yildirim, Northwestern University
View Media
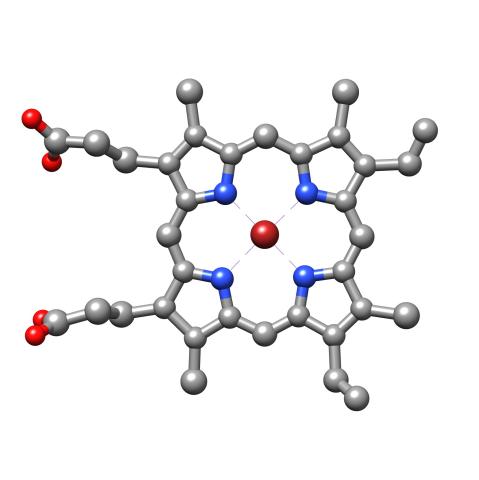
3539: Structure of heme, top view
3539: Structure of heme, top view
Molecular model of the struture of heme. Heme is a small, flat molecule with an iron ion (dark red) at its center. Heme is an essential component of hemoglobin, the protein in blood that carries oxygen throughout our bodies. This image first appeared in the September 2013 issue of Findings Magazine. View side view of heme here 3540.
Rachel Kramer Green, RCSB Protein Data Bank
View Media